

Overview › Visual analysis › Lesson 3
Design logic
Every design asks the same question: does behavior change when, and only when, the conditions change? Each design answers it differently. For each one, this lesson explains where its demonstrations come from, shows graphs that do and don't show experimental control, covers the exceptions and judgment calls analysts make, and ends with a knowledge check.
You will be able to
- Explain where each design gets its prediction, verification, and replication.
- Tell experimental control from its look-alikes in each design, including the accepted exceptions: a baseline trending away from the goal, a partial reversal, a separation that emerges after a few alternations, and behavior that meets a criterion without matching it exactly.
- In a functional analysis, compare every test condition with the control condition, and explain why responding in the demand condition can be capped.
- Answer the knowledge check for each design.
In this lesson: Before any design: trend and when to start · Part A: AB · Part B: Reversal · Part C: Multiple baseline · Part D: Alternating treatments · Part E: Functional analysis · Part F: Changing criterion
Before any design: trend and when to start
Every design begins with a prediction. Baseline data predict what behavior would do if nothing changed, and each later phase is judged against that prediction (Lesson 2). So the first judgment in any design is whether baseline predicts well enough to start the intervention. Usually that means stable data, at least 3 to 5 points, with no trend. One kind of trend is an exception.
- A trend toward the expected change is a problem. If problem behavior is already falling when you start an intervention meant to reduce it, a lower level afterward is what baseline predicted anyway. Wait for the data to level off, or the comparison can't be interpreted.
- A trend away from the expected change is not. If aggression is rising in baseline and the intervention is meant to reduce it, baseline predicts more aggression. A drop after the intervention starts breaks that prediction even more clearly than a drop from a flat baseline would, so you can start without waiting for the data to level off. With a dangerous behavior, waiting while it gets worse is also hard to justify.
The same rule applies inside every design below: when a phase or tier is trending, ask which way. Only a trend toward the change you expect can masquerade as an effect.
Part A: AB design
The logic. Baseline predicts; the intervention phase tests that prediction once. A change when the intervention starts is affirmation of the consequent, but nothing on the graph verifies it or replicates it. Anything else that changed at the same time, such as a new medication, a new teacher, or the end of the school year, could explain it. An AB graph can show change. It can't show experimental control. For standards and practice, see the AB design page.
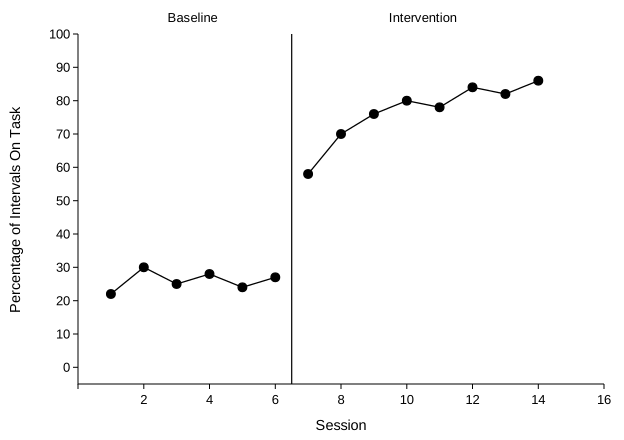
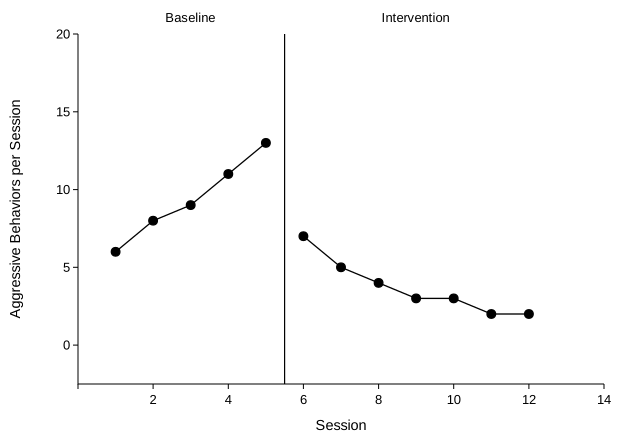
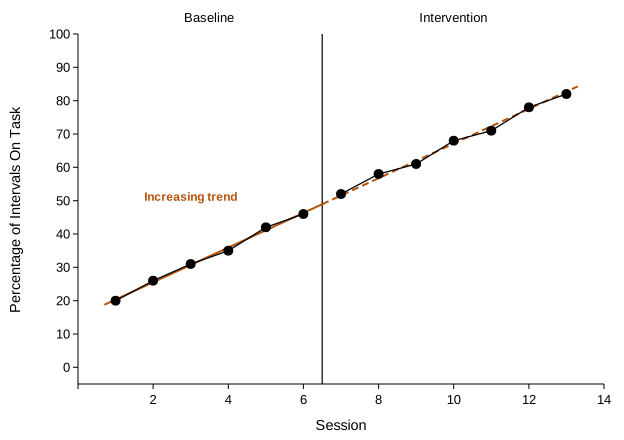
Where AB graphs still help. In practice, an AB graph is a reasonable way to track one client's progress and decide whether to keep an intervention. Describe it as showing change. To show that the intervention caused the change, withdraw and reintroduce it (Part B), or stagger its start across three or more tiers (Part C).
Knowledge check: AB design
1. An AB graph shows self-injury dropping immediately and staying low, with no overlap between phases. What can you conclude?
- The intervention caused the drop.
- Behavior changed when the intervention began, but the graph can't show the intervention caused it.
- Nothing, because a change that large is unlikely to be real.
2. Baseline aggression is rising: 6, 8, 9, 11, and 13 per session. The intervention is meant to reduce it. Should you wait for baseline to stabilize before starting?
- Yes. A trending baseline can never predict.
- No. The trend runs opposite to the change the intervention should produce, so you can start.
- Yes. Wait until aggression peaks, then start.
3. Which change would let this AB study show experimental control?
- Collect more intervention sessions.
- Add a trend line and the dual-criteria lines.
- Withdraw and reintroduce the intervention, or stagger its start across three or more tiers.
Part B: Reversal (ABAB) design
The logic. Each phase has a job. The first baseline predicts. The first intervention phase departs from the prediction (affirmation). Withdrawing the intervention tests the prediction again: if behavior goes back toward baseline, that verifies baseline would have continued without the intervention. Reintroducing it replicates the effect. Introduce, withdraw, and reintroduce give three demonstrations at three different times. For standards and practice, see the reversal design page.
What control can look like
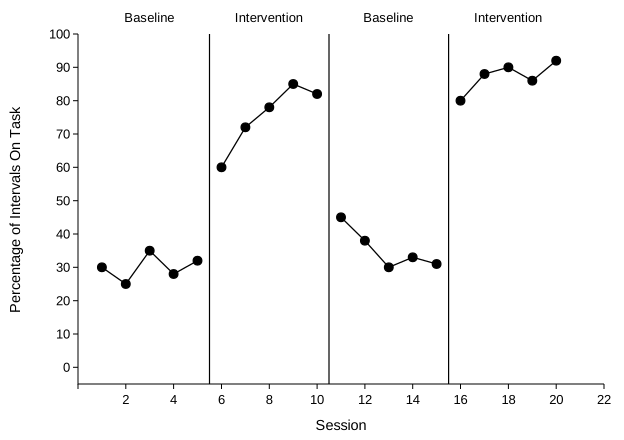
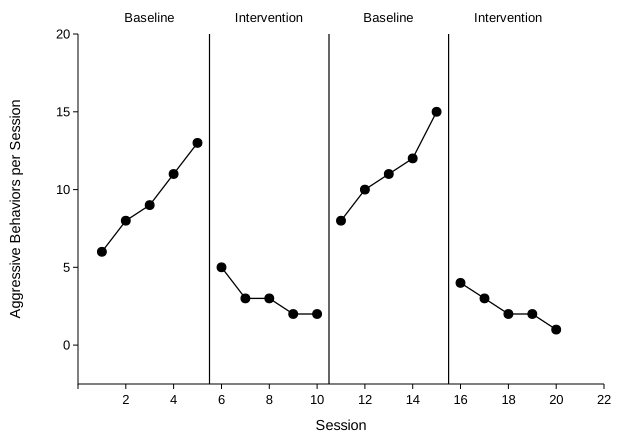
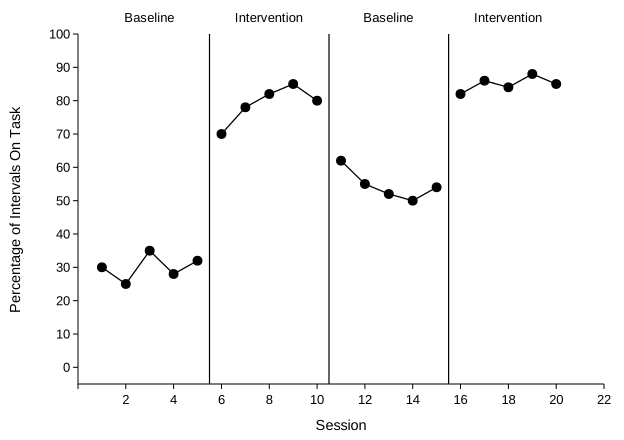
What it doesn't look like
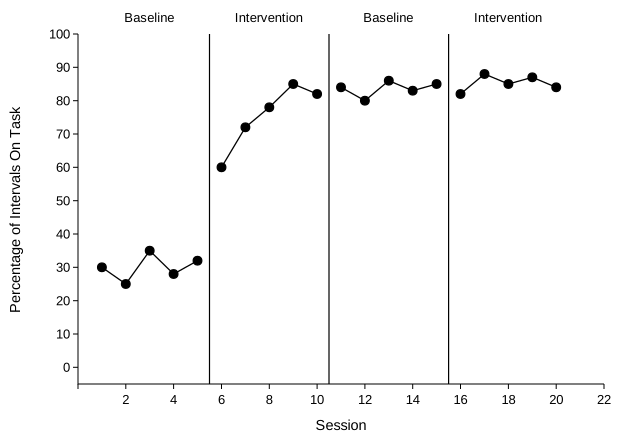
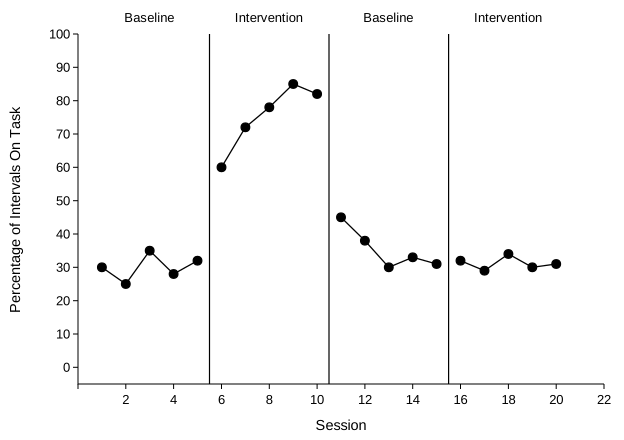
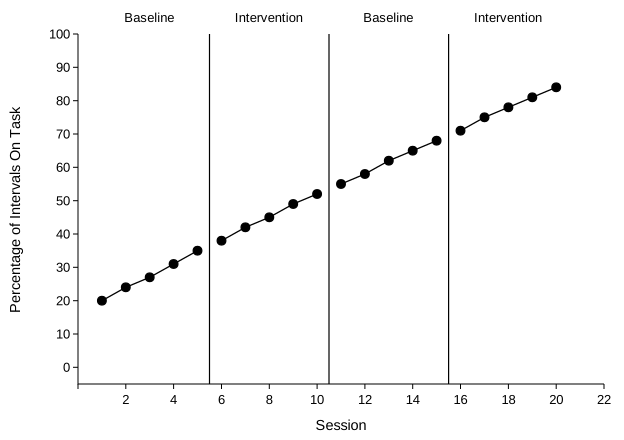
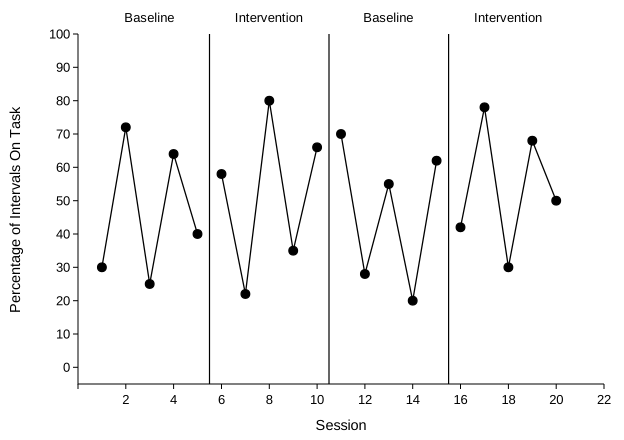
Other judgment calls. A behavior that won't reverse, such as a skill once learned, can't show control in this design, so use a multiple baseline instead. Withdrawing an effective treatment for a dangerous behavior raises ethical questions: keep the withdrawal short, or choose a design that doesn't need one. And when a few sessions pass before behavior shifts at a withdrawal, look at whether the change follows each phase change consistently. A delay that repeats at every change weakens the case less than one that appears only once.
Knowledge check: reversal design
1. Which phase provides verification?
- The first baseline
- The first intervention phase
- The second baseline, after the intervention is withdrawn
- The second intervention phase
2. Baseline aggression was rising. It dropped when the intervention began, rose when it was withdrawn, and dropped again when it returned. Does the rising first baseline undermine control?
- Yes. Any baseline trend rules out control.
- No. The trend ran away from the goal, so it strengthens the case.
- It depends on whether the second baseline also rose.
3. In the second baseline, behavior moves most of the way back toward the first baseline's level but doesn't reach it. Does that rule out control?
- Yes. Behavior must return all the way.
- No. A clear change back toward baseline can still verify, though the evidence is weaker.
- No. Reversals are never judged on how far behavior returns.
4. Why is a reversal design a poor choice for teaching a child to read sight words?
- A learned skill doesn't reverse when teaching stops.
- Reading data are too low to graph.
- It needs more than four phases for skills.
Part C: Multiple baseline design
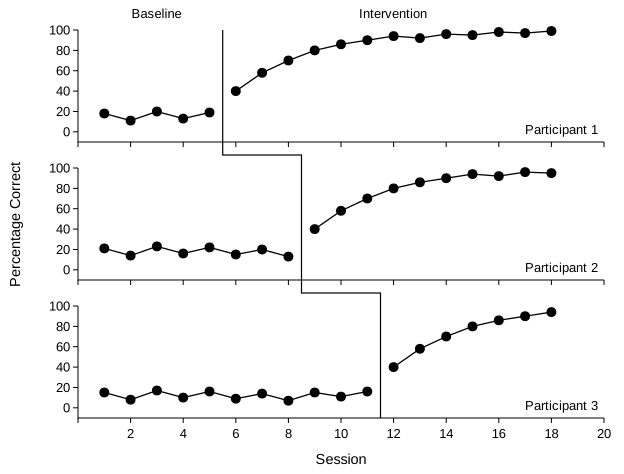
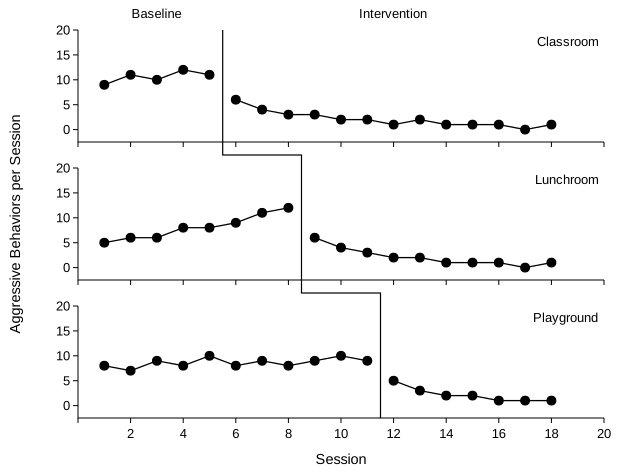
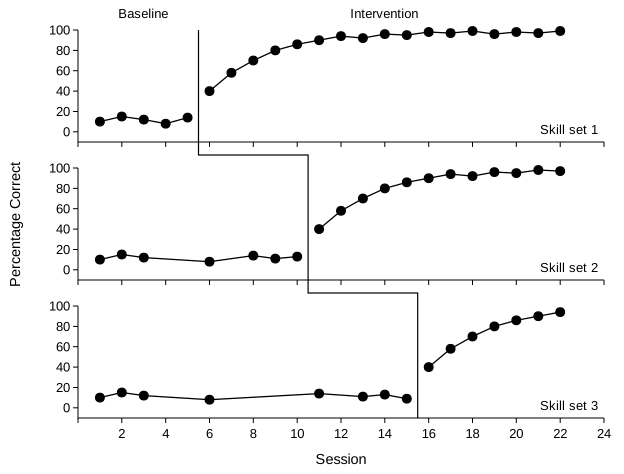
The logic. Three or more tiers, such as participants, behaviors, or settings, start baseline together, and the intervention starts in each at a different time. Read the graph two ways. Horizontally, each tier is its own AB comparison. Vertically, at each start, look down at the tiers still in baseline: they are the verification. If they stay where they were while the treated tier changes, time alone isn't producing the change. Each staggered start replicates the effect. For standards, multiple probe rules, and practice, see the multiple baseline design page.
What control can look like
What it doesn't look like
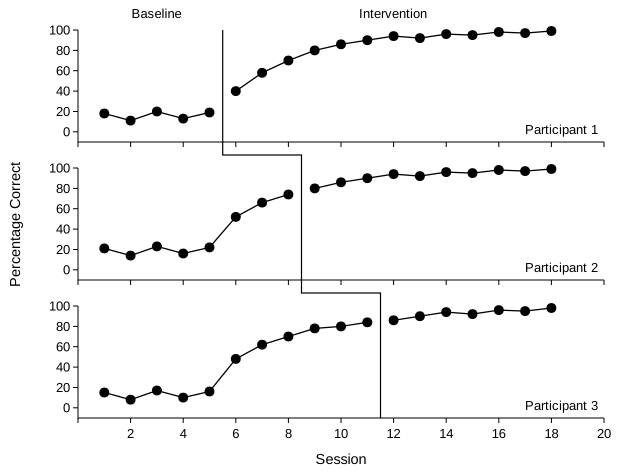
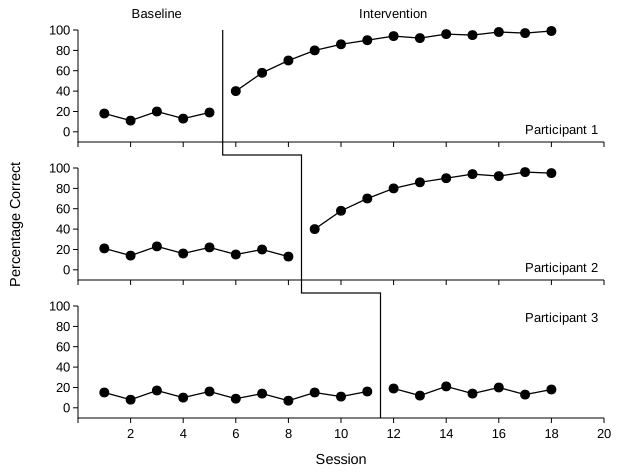
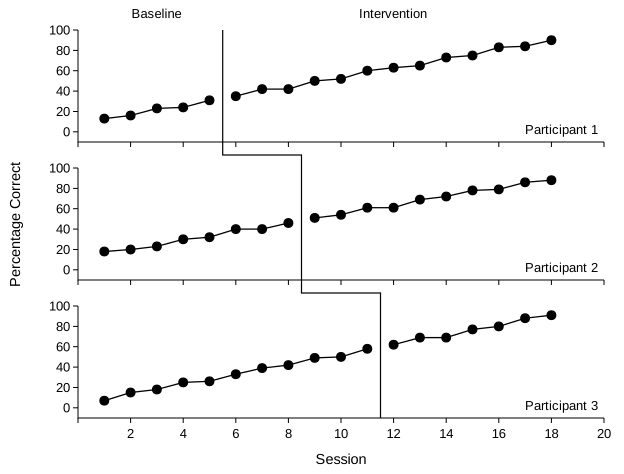
Other judgment calls. If a tier starts improving before its own intervention, extend its baseline until it levels off rather than starting on schedule. Tiers should be similar enough to respond to the same intervention but independent enough that treating one doesn't change another; behaviors of the same person are the most likely to covary. And concurrent tiers, measured over the same calendar time, rule out outside events far better than participants enrolled at different times.
Knowledge check: multiple baseline design
1. When Participant 1 starts intervention, what should Participants 2 and 3 do?
- Improve a little, showing the intervention is spreading.
- Stay at their own baseline levels until their own interventions start.
- Get worse, to show a contrast.
2. While it waits in baseline, the lunchroom tier's aggression rises from 5 to 12 per session. It drops when the lunchroom intervention starts. Can this tier count as a demonstration?
- Yes. The trend ran away from the goal, so it can't explain the drop.
- No. Every tier needs a stable baseline.
- Only if the other tiers were also rising.
3. A tier begins improving steadily two sessions before its scheduled start. What should you do?
- Start on schedule; the plan is set.
- Hold its intervention and extend its baseline until the data level off.
- Drop the tier from the study.
4. Why does a multiple baseline need at least three tiers?
- Two tiers are enough if both change.
- Each tier gives one demonstration, and control needs at least three at different times.
- A graph with fewer tiers can't share an axis.
Part D: Alternating treatments design
The logic. Two or more conditions alternate rapidly, often session by session, in a counterbalanced order with a distinct cue for each. Each condition's data path predicts its next point, and every switch tests that prediction again, so each alternation is a small replication. Control is consistent separation: one path stays above or below the other through many alternations. The conditions are compared with each other, and with baseline if there is one. For standards and the adapted design for teaching skills, see the alternating treatments page.
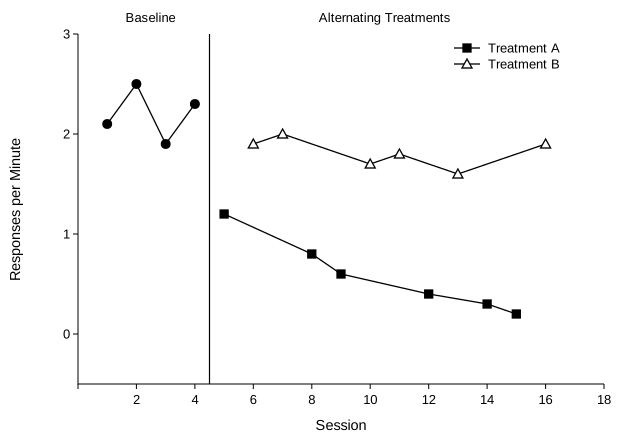
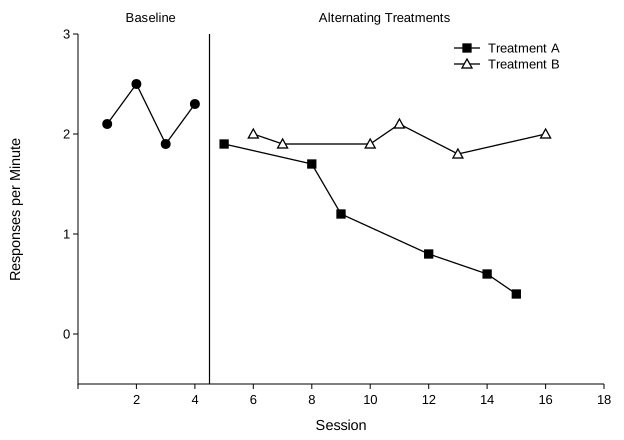
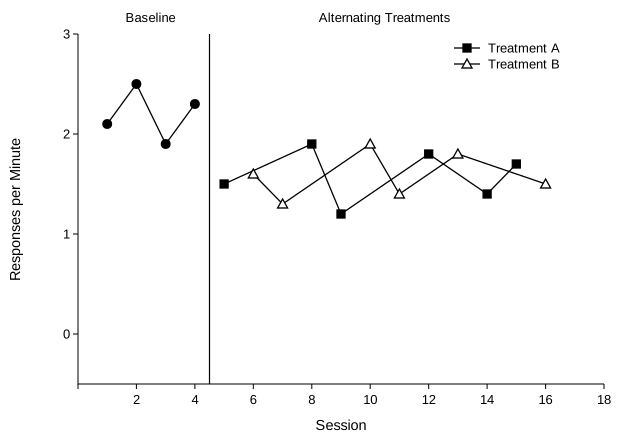
Other judgment calls. If one condition's effect carries over into the next session, the paths converge and can hide a real difference. Counterbalance the order, so that order can't explain the difference, and give each condition its own cue. A skill can't be unlearned between sessions, so compare ways of teaching skills with the adapted design, which gives each procedure its own equated set of targets.
Knowledge check: alternating treatments design
1. What shows experimental control in an alternating treatments design?
- Both treatments are lower than baseline.
- One condition's path stays clearly above or below the other's across many alternations.
- One condition has a higher mean.
2. The two paths overlap for the first two alternations, then separate and stay apart for the next four. What should you conclude?
- No control, because the paths overlapped.
- Control is possible, judged from the alternations after the paths separate.
- Restart the comparison with a different order.
3. Why counterbalance the order of the conditions?
- So the order of sessions can't explain the difference between conditions.
- So each condition gets more sessions.
- So the data are less variable.
Part E: Functional analysis (multielement design)
The logic. A multielement functional analysis rapidly alternates test conditions, each of which arranges one possible reinforcer after problem behavior, with a control condition (Iwata et al., 1982/1994).
- Attention: brief attention, such as a statement of concern, follows each response.
- Demand (escape): the therapist presents tasks, and each response produces a brief break from them, often 30 s.
- Tangible: a preferred item is withheld, and each response briefly returns it.
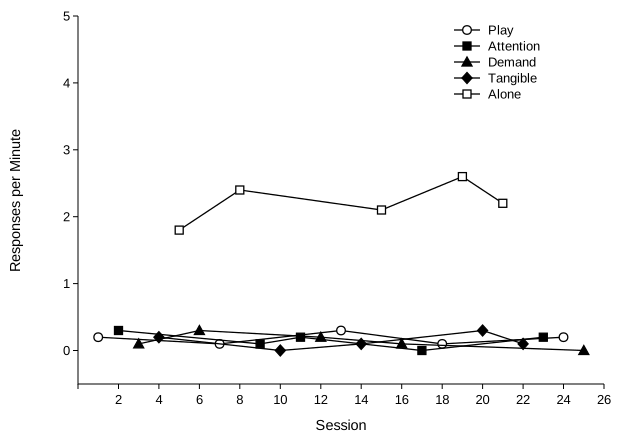
- Alone: no social consequences at all, which tests automatic reinforcement.
- Play, the control: preferred items and attention are freely available, no demands are made, and responses have no consequences.
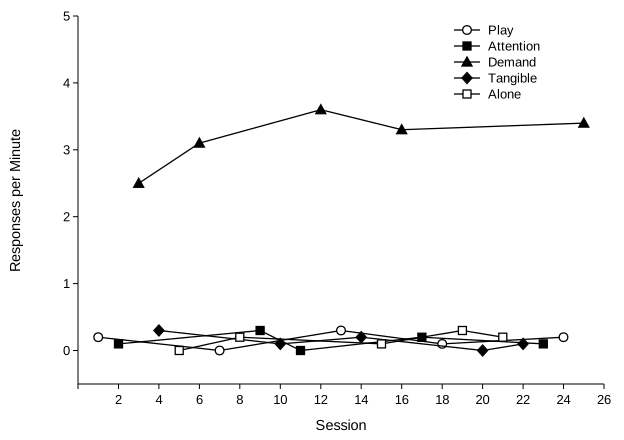
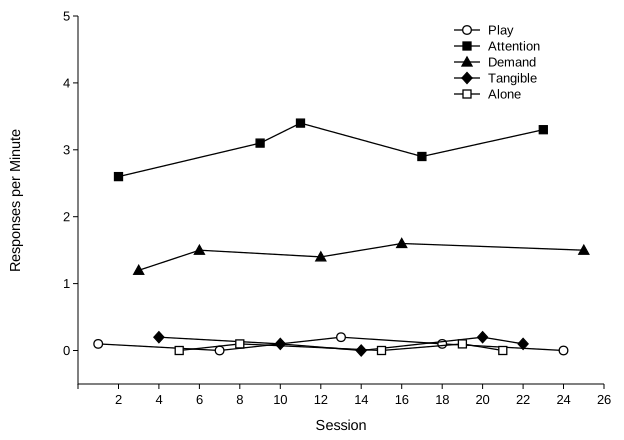
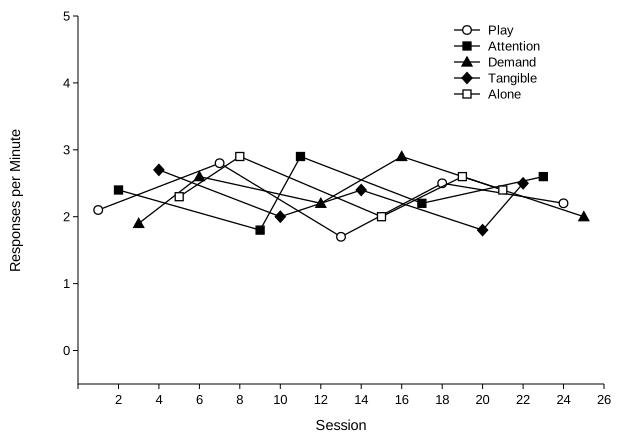
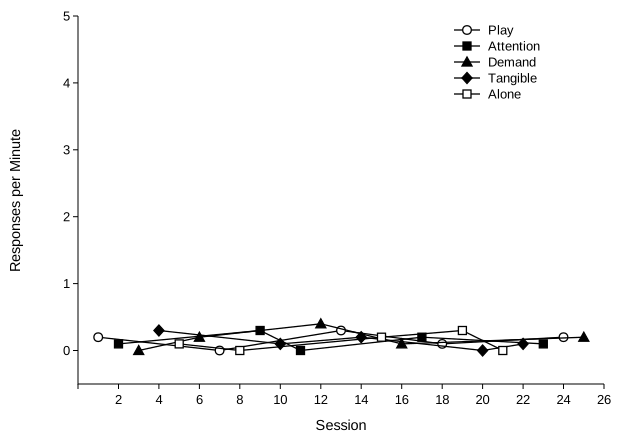
Each test condition is compared with Play, in every cycle, and not with the other test conditions. A test condition that is consistently above Play shows that its reinforcer maintains the behavior; the analysis is then differentiated. Every condition consistently above Play counts, not only the highest one. Structured criteria for these comparisons draw their lines from the control condition for the same reason (Hagopian et al., 1997). For more graphs and practice, see the functional analysis section of the design guide.
Differentiated
Undifferentiated
Why the demand condition can be capped
Rates in different test conditions aren't directly comparable, because each condition limits how often the behavior can occur. The demand condition limits it most. Each response ends the current task and starts a break with no demands, so responding can happen only as often as demands are presented. Suppose presenting a demand takes about 5 s and each response earns a 30-s break. Each demand, response, and break then takes at least 35 s, and a 10-min (600-s) session holds about 17 of them, however strong the escape function. Responding can't go much above 1.7 per minute. In the Attention condition, attention is brief, so the behavior can recur almost at once and its rate has far more room.
So a demand rate lower than the attention rate, as in the two-function example above, doesn't mean escape is the weaker function. What matters is whether Demand is consistently above Play. Some analysts also report the percentage of demands followed by problem behavior, which isn't limited by session length.
Other judgment calls. Look for consistency across cycles, not one high session: a single high Attention point among four at Play's level doesn't show a function. If Play itself is high, nothing can stand out against it, so check whether the control condition really removed the test reinforcers. And some behaviors can't occur in the Alone condition: aggression needs another person. Zero aggression in Alone says nothing about automatic reinforcement, which is why many analyses of aggression use an Ignore condition, with a person present who provides no consequences, instead.
Knowledge check: functional analysis
1. Attention is 2.6 to 3.4 responses per minute, Demand 1.2 to 1.6, and Play 0 to 0.2, each in every cycle. Which functions are shown?
- Attention only, because it is the highest.
- Attention and escape, because both are consistently above Play.
- None, because the two test conditions differ.
2. Why is each test condition compared with Play rather than with the other test conditions?
- Play is the control: it differs from each test condition only in that condition's reinforcer.
- Play always has the lowest rate.
- Play comes first in every cycle.
3. Why can responding in the Demand condition look lower than in Attention, even when escape is a strong reinforcer?
- Escape is usually the weaker function.
- Each response starts a demand-free break, so the number of demands presented caps how often it can occur.
- Demand sessions are shorter.
4. Responding is high in every condition, including Play. What does the analysis show?
- An attention function, because Attention is high.
- It is undifferentiated; automatic reinforcement is possible and needs follow-up.
- The data are invalid and should be discarded.
5. In a functional analysis of aggression, responding is zero in every Alone session. What does that tell you?
- Aggression isn't maintained by automatic reinforcement.
- Little: aggression can't occur with no one there, so an Ignore condition is a better test.
- The whole analysis is undifferentiated.
Part F: Changing criterion design
The logic. After baseline, the intervention sets a performance criterion and changes it in steps. Each new criterion predicts a new level of behavior. When behavior moves to the new criterion promptly and stays near it until the next change, that step is a demonstration, and at least three criterion changes are needed. Subphases of different lengths, steps of different sizes, and a temporary step back down show that behavior follows the criterion, not the passage of time (Hartmann & Hall, 1976). For standards and practice, see the changing criterion page.
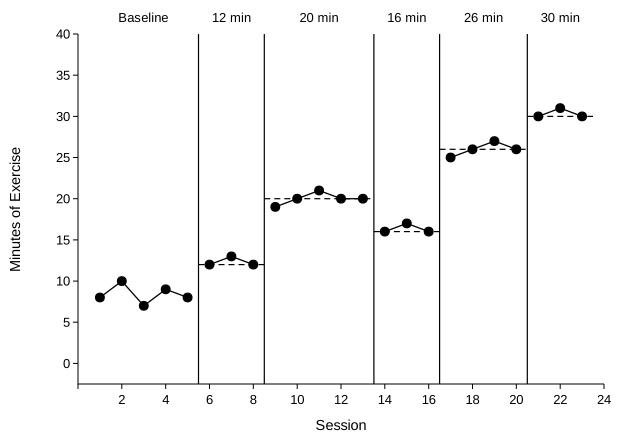
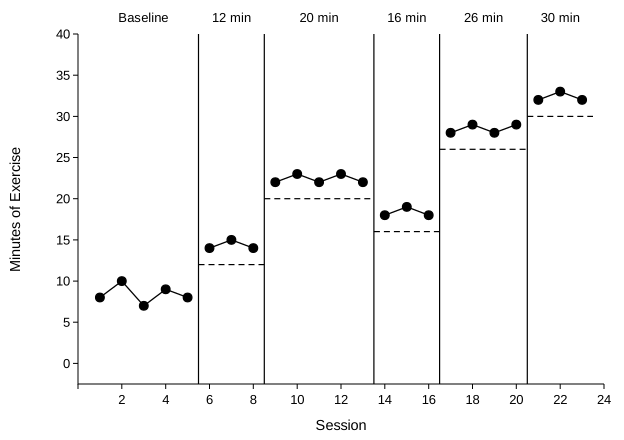
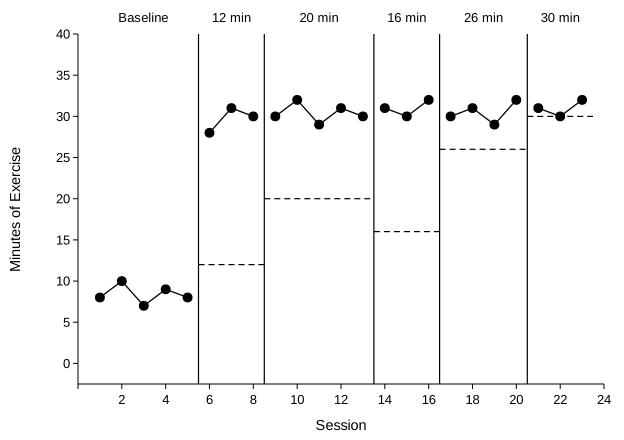
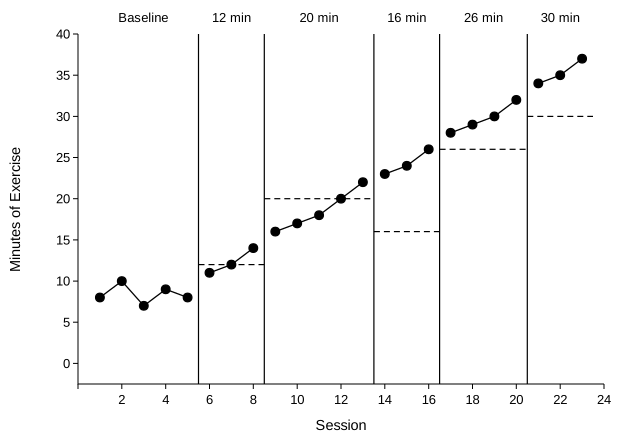
Other judgment calls. If behavior moves to the next level before the criterion changes, the criterion isn't what moved it. The step back down is optional, but it is the strongest test: steady improvement over time can't explain a drop. And when the criterion is set as a range rather than a single value, judge whether behavior stays inside each new range.
Knowledge check: changing criterion design
1. What counts as one demonstration in a changing criterion design?
- The change from baseline to the final criterion.
- Each criterion change that behavior follows promptly and then levels off near.
- Each session in which behavior meets the criterion.
2. Exercise runs 2 to 3 minutes above every criterion, but shifts with each change, including a step back down. Does the graph show control?
- Yes. Behavior follows each criterion even though it doesn't match it exactly.
- No. Behavior must match each criterion exactly.
- No. The step back down makes the result unclear.
3. Why should subphases differ in length and steps differ in size?
- To keep the participant from getting bored.
- So steady improvement over time can't line up with the criterion changes by chance.
- So each subphase has enough data points.
Next, structured visual aids and the dual-criteria method in Lesson 4. For mixed graphs from every design, use the practice at the end of Lesson 2.