

Google Sheets lessons
Build it in Google Sheets
Seven lessons take you from the practice data to a figure ready for submission, free and in your web browser. They follow the same stages as the Excel lessons, so Lesson 4 is phase-change lines and labels in every tool. Choose the graph you want to make, and every lesson shows its data, cell ranges, and axis values, with numbered steps and a picture downloaded from Google Sheets at each stage.
Instructions for:
Lessons
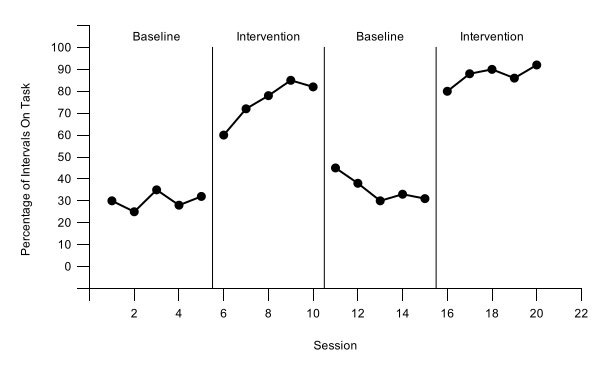
Lessons 1 to 4 build the core skills on one reversal (ABAB) design graph, starting with the top tier (Participant 1) as a full-size chart. Lessons 5 and 6 apply the same skills to other designs, so you can skip them for this graph. Lesson 7 takes the figure into your manuscript or class paper.Lesson 5 copies that tier for each participant and stacks the tiers in Google Slides with a stepped phase-change line. Lesson 6 covers other designs, so you can skip it. Lesson 7 takes the figure into your manuscript or class paper.Lesson 5 covers multiple baseline graphs, so you can skip it. Lesson 6 recaps the settings your design needs, for when you graph your own data, and Lesson 7 takes the figure into your manuscript or class paper.
Set up your data
Session in column A and one column per phase, so the chart breaks the data path at every phase change.Session in column A and one column per condition, so each condition becomes its own data path.
About 5 minutes → 2Create the chart
Insert a line chart that uses the session numbers in column A as a number line, and keep Sheets’ default size.
About 5 minutes → 3Format for APA style
Black data paths joined across blank cells, with a point shape for each condition; no border, legend, or gridlines; a floating zero on the vertical axis, session 0 hidden, and axis titles, all in the chart editor.
About 15 minutes → 4Phase-change lines and labels
Lines and labels built from helper rows under your data, so they never drift out of place.One phase-change line and labels built from helper rows, plus labels that name the two treatments beside their paths.Phase-change lines, labels, and dashed criterion lines, all built from helper rows under your data.A multielement graph has no phase-change lines; instead, add a legend that names each condition.
About 20 minutes → 5Multiple baseline graphs
Not needed for your graphShort tiers copied from one chart, stacked in Google Slides with tier names and a stepped phase-change line.
About 30 minutes → 6Alternating treatments, multielement, and changing criterion
Not needed for your graphThe extra settings these designs need in Google Sheets: paths joined across blank cells, a point shape per condition, path labels or a legend, and dashed criterion lines.
About 15 minutes → 7Download and place the figure
Download a vector file, then add the APA figure number, title, and note, and alt text.
About 10 minutes →Before you start
- Graph type: choose your graph in the box at the top of this page or in the bar at the top of any lesson. Every lesson then shows that graph’s data, cell ranges, axis values, and pictures. Keep the same choice from Lesson 1 to Lesson 7 so your sheet matches the steps. If you make no choice, the lessons show the reversal (ABAB) graph.
- For a class: if your teacher gave you an assignment link or code, start at Your graphing assignment. It gives you your own data and graph type, and ends with a report to hand in. Choose that same graph type in the lessons. Your data have their own values and number of sessions, so your cell ranges, helper rows, axis limits, and phase-change positions and axis limits can differ from the ones the lessons show. Working on your own? Check the figure from Lesson 7 against the self-review checklist, and use the Visual analysis lessons to interpret what your graph shows.
- What you need: a free Google account and any current web browser, on Windows, Mac, or Chromebook. There is nothing to install or buy. The steps are the same on every computer, so these lessons have no Windows/Mac switch; where a keyboard shortcut matters, the lesson gives both (Ctrl, or ⌘ on a Mac). Lesson 5 also uses Google Slides, which comes with the same account.
- Your files stay yours: the spreadsheet you make lives in your own Google Drive, private to you unless you share it.
- Google Sheets version: written for Google Sheets as of October 2026. Google updates Sheets often, so a menu may move or be renamed; look for the setting names the lessons give.
- Pictures: every graph picture was downloaded directly from Google Sheets (the stacked figure, from Google Slides), and each graph type has its own set.
- Practice files: Practice data for your graph (.xlsx) downloads as practice-reversal-data.xlsx and holds the reversal (ABAB) design data the lessons use. Participant 1 (columns A:C) is for Lessons 1–4; Participants 2 and 3, in the same file, are for Lesson 5. Bring it into a new spreadsheet with File›Import (Lesson 1 shows how). To try Lesson 5 as well, use the multiple baseline data.
- Excel or Prism instead? The same stages are taught in Build it in Excel and Build it in GraphPad Prism.