

Overview › Build it in Google Sheets › Lesson 7
Download and place the figure
Download the chartfigure as a file a journal will accept, put it in your manuscript with an APA-style figure number, title, and note, and add alt text.
You will be able to
- Download the chart from Google Sheetsstacked figure from Google Slides as a vector file, and place it in a manuscript with an APA figure number, title, and note.
- Write alt text that names the graph type, the behavior, and the pattern a reader should see.
- Decide whether a graph is ready to submit and, if not, name its problem, in the practice at the end.
Part A: Final check
- Confirm the size. The chart should still be Google Sheets' default size, 600 × 371 pixels (Lesson 2). It downloads at the size it has on the sheet. The slide that holds the three tiers should be 6.5 × 7.6 inches (File›Page setup in Google Slides), with every tier 6.5 inches wide (Lesson 5). If you changed the data, click Update on each linked chart first.
- Run the checklist. Score the graph with the self-review checklist (print it or tick it on screen). Look especially at the fonts, no color, the floating zero, the hidden session 0, phase labels over every phase, and phase-change lines that run from the horizontal axis to the top of the data.phase labels on the top tier only, and phase-change lines that run the full height of each tier's data, joined by the stepped line between tiers.phase labels over both phases, a phase-change line that runs from the horizontal axis to the top of the data, and a different point shape for each treatment, named beside its path.and a different point shape for each condition, named in the legend. A multielement graph has no phase-change lines.phase labels over every subphase, phase-change lines that run from the horizontal axis to the top of the data, and dashed criterion lines that stay inside their own subphase. The checklist asks for phase labels above the plot area and phase-change lines that run its full height. In Google Sheets the labels sit in a band at the top of the plot instead, the phase-change lines stop at the top of the data just below that band, and the vertical axis has one unlabeled tick at the top (Lesson 4, Part B). That is the expected result in Sheets, not a mistake.
Part B: Save the graph as a picture file
Choose a vector format when you can. Vector files store lines and text as shapes, so they stay sharp at any size and are what most journals prefer for line art.
- Open Download chart. Click the chart, then its three-dot menu (at the chart's top right), and choose Download chart.
- Pick a format.
The SVG downloads as chart.svg, 600 × 371, on a white background. Sheets draws all of its text as outlines, so the figure looks the same on every computer, but you can’t edit the text in it afterward. To change a label, change it in Google Sheets and download again.
Format Use it for Scalable Vector Graphics (.svg) Vector. Sharp at any size; good for journals that accept SVG and for websites and slides. PDF document (.pdf) Widely accepted by journals for figures. PNG image (.png) Image. Fine for posters, slides, and course work. - Rename the file. Use a name that matches the manuscript, such as Figure 1.svg. Turning it in for a class? Put your last name and the graph type in the name, such as Lastname ABReversalAlternating TreatmentsFunctional AnalysisChanging Criterion Figure 1.png, unless your instructor asks for a different name or format (see class assignments).
- Download the slide. In Google Slides, choose File›Download›Scalable Vector Graphics (.svg, current slide). PDF and PNG are in the same menu. Download the whole slide, not the single tier from Lessons 1 to 4: the slide is the figure.
- Know what you have. The SVG keeps the stepped lines and the tier names as vector shapes, but Slides puts each linked chart into it as a picture. Open the file and zoom in to check that the tiers are sharp enough at the size the figure will be printed.
- Rename the file. Use a name that matches the manuscript, such as Figure 1.svg. Turning it in for a class? Put your last name and the graph type in the name, such as Lastname Multiple Baseline Figure 1.png, unless your instructor asks for a different name or format (see class assignments).
Check your journal's figure requirements. Many journals ask for vector files (PDF, EPS, or SVG) or high-resolution TIFF for line art, often 600 dpi or more at final size. A PNG downloaded from Google SheetsSlides is only as detailed as its pixel size. If a journal requires a high-resolution TIFF, download a vector file and convert it, or ask the journal's production team which vector format they accept.
Part C: Put the figure in your manuscript
- In Word, insert the picture file. Choose Insert›Pictures, then This Device (Windows) or Picture from File (Mac), select the file you downloaded, and click Insert. A picture can’t change by accident.
- In Google Docs, insert the chart from Sheets, or the picture.insert the picture. Choose Insert›Chart›From Sheets, pick your spreadsheet, click Insert, pick the chart, leave Link to spreadsheet ticked, and click Import. It works like the Google Slides import: the chart stays linked to your spreadsheet, and when the data change, Docs offers an Update button. Inserting the downloaded picture instead keeps the figure fixed; Google Docs can’t insert an SVG, so download the PNG for Docs (Insert›Image›Upload from computer). The figure was assembled in Google Slides, so insert the picture you downloaded (Insert›Image›Upload from computer). Use the PNG: Google Docs can’t insert an SVG. A single tier inserted with Insert›Chart›From Sheets would leave out the other tiers and the stepped line.
- Add the figure number and title above, and the note below. Follow the APA layout shown below. Check that the figure's text, at the size it appears on the page, is between 8 and 14 points.
Figure 1
Percentage of Intervals On Task Across Baseline and Token Economy Phases
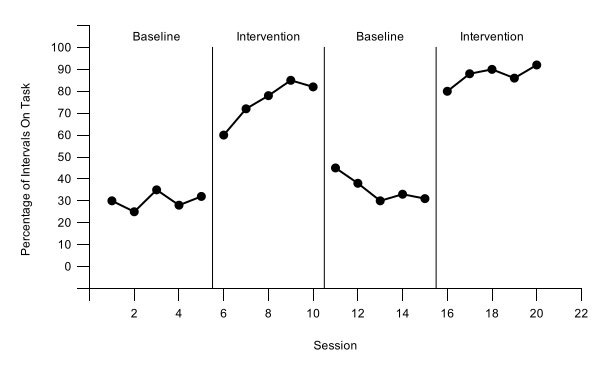
Note. Data are percentages of 10-s intervals with on-task behavior for one participant. Baseline = no programmed consequences; Intervention = token economy.
- Figure number: bold, on its own line above the figure (Figure 1).
- Title: one double-spaced line below the number, in italic title case.
- Note: below the figure. Start with Note. in italics and explain abbreviations, measures, or anything not obvious from the graph.
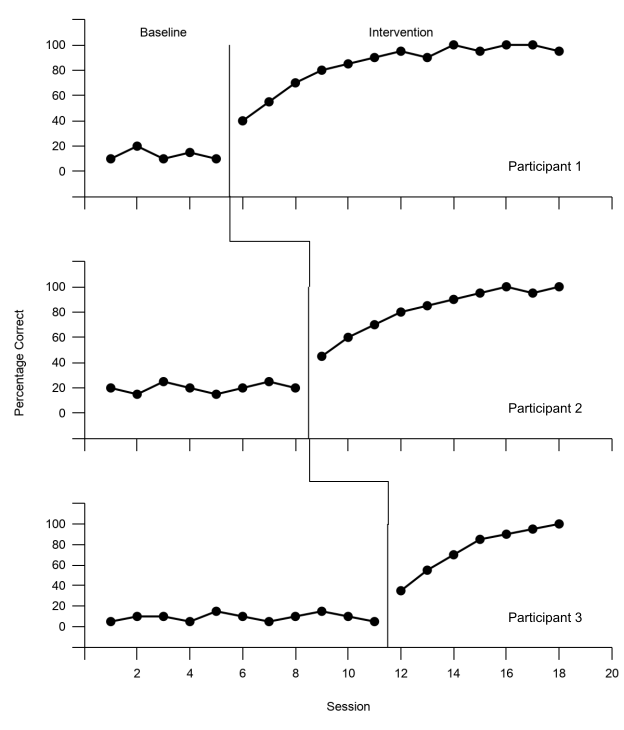
- One figure, all tiers: place the whole slide from Lesson 5, not the single tier from Lessons 1–4. The tier names (Participant 1, 2, and 3) sit inside the panels, so the note does not need to explain them.
- Path labels: the words beside each path name Treatment A and Treatment B, so the note does not need to explain the point shapes.
- Legend: keep it with the graph. Because it names Play, Attention, Demand, Tangible, and Alone, the note does not need to explain the point shapes.
- Criterion lines: say in the note what the dashed lines show, as the example does.
- No title inside the graph. The title belongs in the manuscript text, so the chart has none (Lesson 3 left the chart title empty).
- Refer to every figure in the text, and number figures in the order you first mention them.
Part D: Add alt text
- Open alt text. In Word, right-click the picture (Control-click on a Mac) and choose View Alt Text or Edit Alt Text. In Google Docs, select the image or chart and choose its alt text option from the right-click menu. The chart in Google Sheets has one too: its three-dot menu › Alt text.
- Describe the finding, not the decoration. For example: "Reversal graph of on-task behavior. On-task behavior was low in both baseline phases (25% to 45% of intervals) and high in both token economy phases (60% to 92%). It rose each time the token economy began and fell when it was withdrawn.""AB graph of problem behavior. Problem behavior occurred in 48% to 66% of intervals during baseline and decreased during intervention, from 40% in the first intervention session to 5% in the last.""Multiple baseline graph of correct responses for three participants. Baseline scores were 25% or lower for every participant. Accuracy rose only after intervention began for that participant, after sessions 5, 8, and 11, and reached 95% to 100% by the last sessions.""Alternating treatments graph of responses per minute. Responding was 1.9 to 2.5 per minute in baseline. When the two treatments alternated, Treatment A decreased from 1.2 to 0.2 per minute, while Treatment B stayed between 1.6 and 2.0.""Multielement functional analysis graph of responses per minute in five conditions. Responding was highest in the Demand condition (2.5 to 3.6 per minute), near 1 per minute in Attention, and 0.6 per minute or lower in Tangible, Alone, and Play.""Changing criterion graph of minutes of exercise. Exercise was 7 to 10 minutes per session in baseline. In each of the five criterion phases (12, 20, 16, 26, then 30 minutes), including the step back down to 16 minutes, it stayed within 1 minute of the criterion in effect." Name the graph type, the behavior, and the pattern a reader should see. Leave out formatting such as fonts, line weights, and tick marks.
Who can see your spreadsheet? Your spreadsheet and presentation stay in your own Google Drive, private to you unless you share them. If a teacher or coauthor needs to see the work, share it so they can view but not edit it. For a class, hand in the picture file and any report your instructor asks for.
Practice
Before you submit, practice spotting the problems reviewers look for. On the Visual analysis practice page, each graph has one problem, or none: decide whether it is ready to submit and, if not, name its problem.
You finished the Google Sheets lessons. Next, learn to read the graphs you make in Visual analysis, or see the same stages in Build it in Excel.