

Free tutorials, practice, and class assignments
Which graph do you want to make?
Choose a single-case design. Every Excel lesson then follows your graph type, with its own data, steps, and pictures, on Windows or Mac, with or without AI. Flip between control and no control to see what a reviewer will look for.
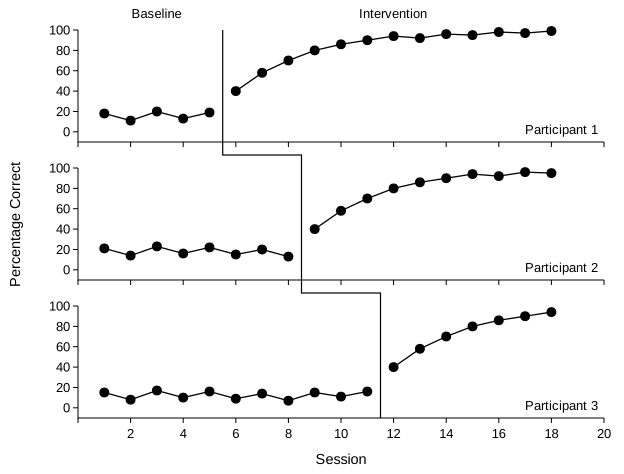
ControlBehavior changes every time the intervention is introduced or withdrawn: three demonstrations.
What's on this site
Build · 7 lessonsBuild it in Excel
Windows and Mac, every stage pictured, from data layout to vector export.
 Analyze · live practice
Read the graph
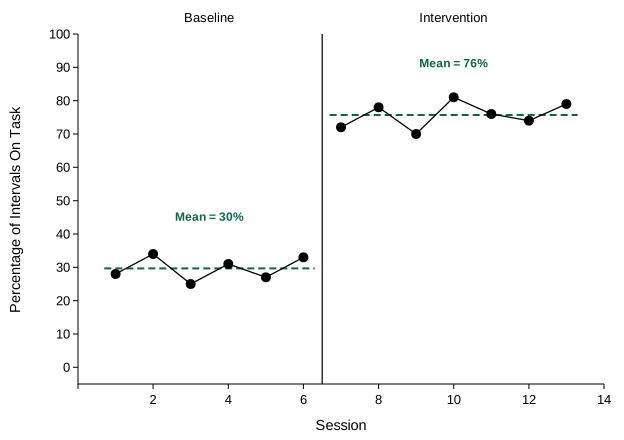
Six features, experimental control, dual-criteria, variance. New graphs every time.
 Decide
Choose a design
Up to five questions to a design that can show control.
 Build · free · 7 lessons
Build it in Google Sheets
Free, in your browser. Same data and stages as the Excel lessons.
Build · Prism 10 · 7 guidesBuild it in GraphPad Prism
The same data and stages as the Excel lessons, in Prism 10.
Build fasterWith AI in Excel
Claude or ChatGPT, with prompts that encode every rule.
DownloadTemplates
Six designs; lines and labels update themselves.
Before you submitChecklist
Score your graph item by item, on screen or on paper.
For teachersAssign a graph to your class
Every student gets their own dataset, builds the graph in Excel, decides whether it shows experimental control, and submits a printable report. You get an answer key and a rubric.
What a publication-ready graph looks like
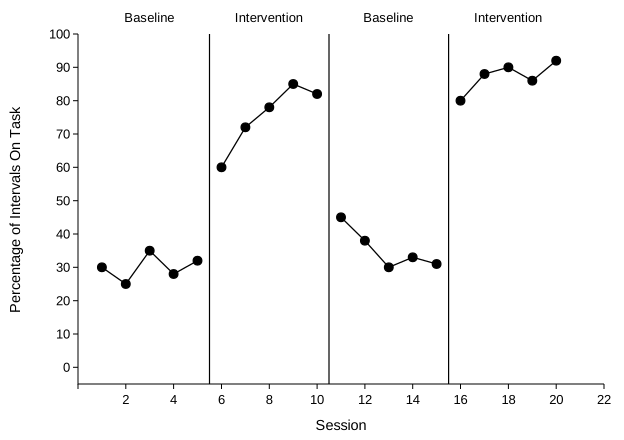
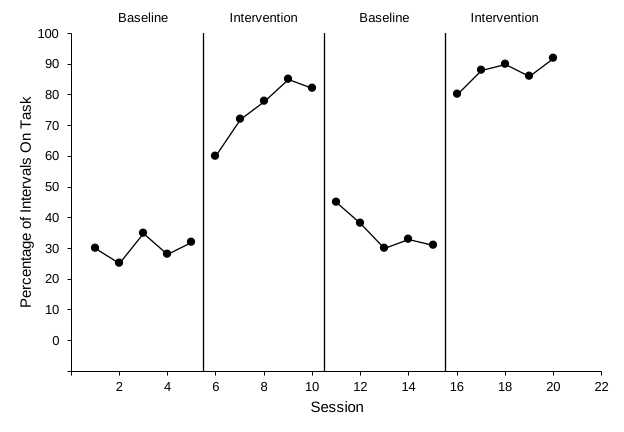
Single-case graphs follow conventions that go back decades in behavior-analytic journals. APA style adds rules for fonts, labels, and the figure caption. This is the reversal graph you will build in the Excel lessons.
Note. Data are percentages of 10-s intervals with on-task behavior for one participant. Baseline = no programmed consequences; Intervention = token economy.
- Phase labelsShort names centered over each phase, above the plot area.
- Phase-change linesSolid vertical lines placed halfway between the last session of one phase and the first session of the next.
- The data path breaksData points are never connected across a phase change. Each phase is plotted as its own series.
- Black data points and linesThe graph must read in black and white. Conditions are told apart by marker shape and fill, not by color.
- Floating zero and clean axesZero sits slightly above the horizontal axis, so data points at 0 stay visible. In Excel the gap is one major unit, because Excel starts its tick marks at the axis minimum. Both axes are black lines with outward tick marks at sensible intervals, and the plot area is about two-thirds as tall as it is wide.
- Axis titlesName the measure and its unit in title case, such as Session and Percentage of Intervals On Task.
- Nothing extraRemove gridlines, legends you don't need, borders, shading, 3-D effects, and the chart title. The title belongs in the figure caption instead.
- APA figure number, title, and noteIn the manuscript, a bold figure number and an italic title in title case go above the graph, and a note that starts with Note. goes below it to explain the measure and the phases.
Before you submit any graph, including one built with AI, score it item by item with the self-review checklist, on screen or printed.
About these tutorials
The lessons were written for Excel in Microsoft 365 as of October 2026 (Windows, and Mac version 16). Excel 2021 and 2024 use the same menus. Every graph picture in the Excel lessons was exported directly from Excel, so your screen should look the same. The drawings of Excel's menus and panes are simplified, and their layout may differ slightly from your version. The method follows long-standing guidance on graphing single-case data in Excel. That guidance uses separate columns for each phase, with phase-change lines and labels attached to the data so they stay in place when the graph is resized. The sources page lists the published tutorials, graphing standards, and training studies these lessons draw on.
Single-Case Design Graphs was created by Anthony Concepcion, PhD, BCBA-D. To cite the site: Concepcion, A. (2026). Single-case design graphs. USF.ac. https://www.usf.ac/ssd/