

Templates
Templates
Six ready-made Excel workbooks for the most common single-case designs, plus a finished GraphPad Prism project for each. In a workbook, type your data in the yellow cells. The graph, phase-change lines, phase labels, and criterion lines all update automatically. Each workbook already follows the formatting from the tutorials and includes a How to use sheet.
Your graph type: Its template is marked below, and the practice data for following the lessons is practice-reversal-data.xlsx.
Templates
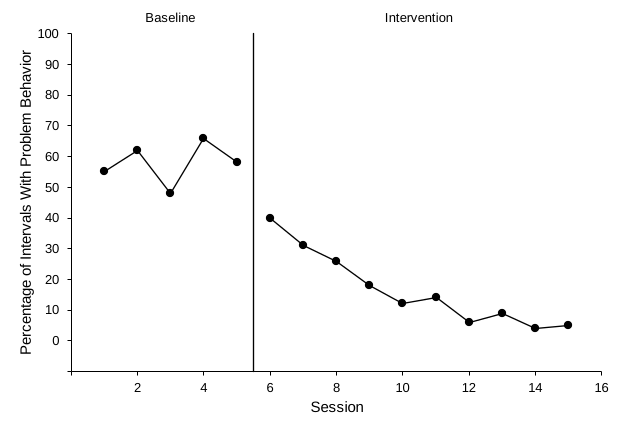
AB design
Baseline followed by intervention. The simplest single-case graph and a good starting point.
- Up to 40 sessions
- Automatic phase-change line and labels
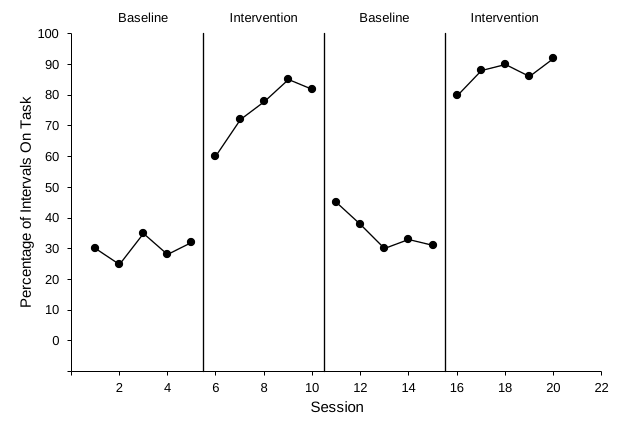
Reversal (ABAB)
Baseline, intervention, return to baseline, and reintroduction. The workbook has four phase columns and three automatic phase-change lines.
- Rename phases in the label cells (for example, Token Economy)
- Matches Excel Lessons 1–4
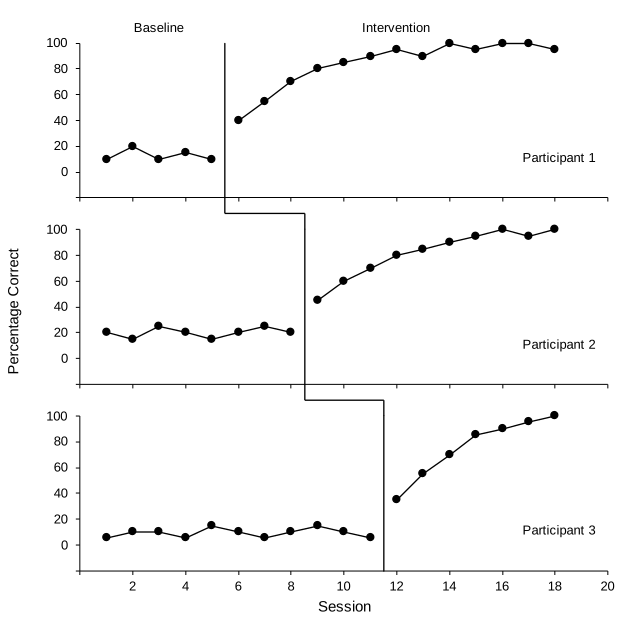
Multiple baseline (3 tiers)
Across participants, behaviors, or settings. The tiers are aligned and grouped, with a shared vertical title, tier names from cells, and a stepped phase-change line.
- Each tier's phase-change line moves with its data
- Connector segments between tiers are shapes: nudge them if your timing differs, and hide them while a tier is still in baseline
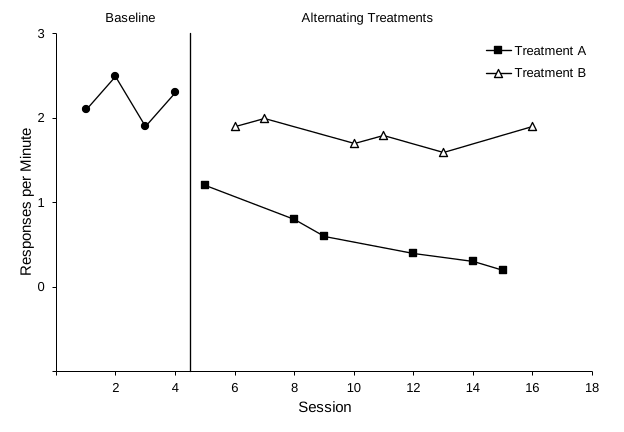
Alternating treatments
A baseline followed by two conditions alternated across sessions. Each condition has one continuous path and its own black-and-white marker.
- Points connect across blank cells
- Legend lists only the treatments
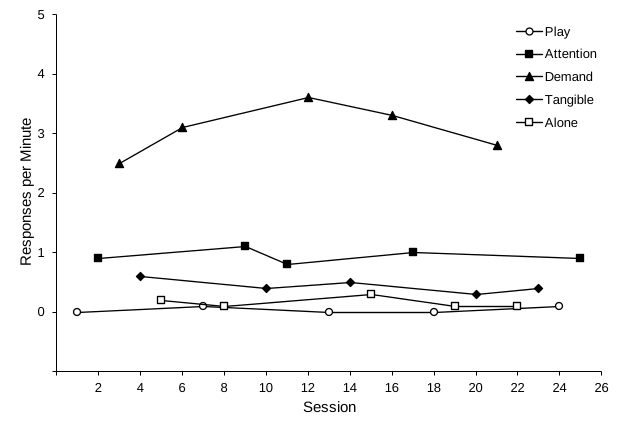
Multielement functional analysis
Five rapidly alternating conditions (Play, Attention, Demand, Tangible, Alone) with distinct markers and a legend inside the plot.
- Rename conditions in the yellow headers; the legend follows
- Rates shown in responses per minute
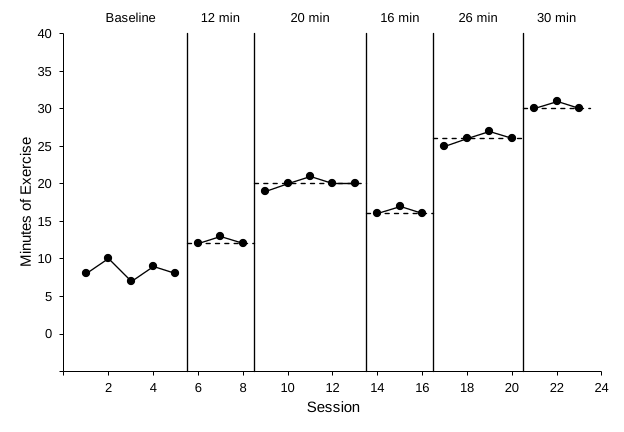
Changing criterion
A baseline and five subphases of different lengths, each with a dashed criterion line and a label. Type the criteria in the yellow cells.
- Criterion lines span each subphase automatically
- Criteria and labels are typed in yellow cells
GraphPad Prism example projects
A finished Prism project for each graph type, built with the steps in Build it in GraphPad Prism: the practice data in an XY table and the formatted graph, with phase-change lines and labels as additional X-axis ticks. Open one to compare with your own graph, or replace its data with yours. The .prism file needs Prism 10; the .pzfx file opens in older versions too.
| Graph type | Prism 10 | Older Prism |
|---|---|---|
| AB design | ab-design.prism | ab-design.pzfx |
| Reversal (ABAB) | reversal-abab.prism | reversal-abab.pzfx |
| Multiple baseline (3 tiers in a layout) | multiple-baseline.prism | multiple-baseline.pzfx |
| Alternating treatments | alternating-treatments.prism | alternating-treatments.pzfx |
| Multielement functional analysis | multielement-fa.prism | multielement-fa.pzfx |
| Changing criterion | changing-criterion.prism | changing-criterion.pzfx |
Using Google Sheets? There is no Sheets template to download. Build the graph in a spreadsheet in your own Google Drive with Build it in Google Sheets, starting from the practice data for your graph type. Its helper rows hold the phase-change lines and labels, so the finished spreadsheet works as your own template.
How the Excel templates work
| A | B | C | D | E | F | G | |
|---|---|---|---|---|---|---|---|
| 4 | Session | Baseline | Intervention | Settings | |||
| 5 | 1 | 55 | Y-axis maximum | 100 | ← yellow = you type | ||
| 6 | 2 | 62 | Y-axis minimum | -10 | |||
| … | … | … | Baseline | Intervention | 5.5 | ← grey = automatic |
- Download and open the template. Use Excel for Windows or Mac (Excel 2019 or later, or Microsoft 365). If Excel opens it in Protected View, click Enable Editing.
- Replace the example values. Type your own values in the yellow data columns, and delete leftover example values you don't need. Leave the other cells empty, not 0; cells showing
#N/Afrom the Excel Lesson 1 formulas also work. Phase-change lines, labels, and criterion lines appear only for phases that have a value, so you can start with baseline data alone. - Edit the labels. Type your own text in the yellow label cells. To change an axis title, click it on the graph and type.
- Adjust the axes if needed. Double-click an axis and set its Minimum and Maximum. Keep the vertical minimum exactly one major unit below 0 (the floating zero). In every template except the multielement one, type the same numbers in the Y-axis maximum and Y-axis minimum cells. In the multiple baseline template, change all three tiers, and when you change the horizontal Maximum, type it in the X-axis maximum cell too, so each tier name stays at the right edge of its graph.
- Resized the graph? Check that any phase labels still sit above the plot area. If one slips onto the plot, click an empty spot in the plot area and drag the handle in the middle of its top edge down until the labels clear it.
- Check and export. Score the graph with the self-review checklist, export it with Save as Picture (Excel Lesson 7), and add the figure number, title, and note in your manuscript.
Pair a template with AI. Ask Claude or ChatGPT in Excel to copy your data into the template's yellow cells. See this prompt, which works for every template if you change the column descriptions. The layout and formatting stay exactly as designed.
Practice data. To follow the tutorials with data only and no chart, download the practice workbook for your graph: AB, reversal, multiple baseline, alternating treatments, multielement, or changing criterion.
Templates are plain .xlsx workbooks with no macros. Phase-change positions use MINIFS/MAXIFS, which need Excel 2019, 2021, 2024, or Microsoft 365. Example data are fictional.