

Overview › Build it in Excel › Lesson 7
Export and place the figure
Save the graph as a file a journal will accept, put it in your manuscript with an APA-style figure number, title, and note, and add alt text.
You will be able to
- Export the chartgrouped figure as a vector file and place it in a manuscript with an APA figure number, title, and note.
- Write alt text that names the graph type, the behavior, and the pattern a reader should see.
- Decide whether a graph is ready to submit and, if not, name its problem, in the practice at the end.
Part A: Final check at final size
- Confirm the size. Select the chart and check the height and width on the Format tab. They should match the size the figure will be printed (Lesson 2). Click the grouped multiple baseline figure once so the whole group is selected, and check its height and width on the Format tab (Shape Format in some versions). It should be as wide as the tiers you made in Lesson 5 and fit on the printed page.
- Run the checklist. Score the graph with the self-review checklist (print it or tick it on screen). Look especially at fonts between 8 and 14 pt, no color, the floating zero, phase labels above the plot area, and phase-change lines that run the full height of the plot.phase labels above the top tier’s plot area, and phase-change lines that run the full height of each tier, joined by the stepped line between tiers.phase labels above the plot area, a phase-change line that runs the full height of the plot, and a different marker for each treatment, named in the legend.and a different marker for each condition, named in a legend that covers no data. A multielement graph has no phase-change lines.phase labels above the plot area, phase-change lines that run the full height of the plot, and dashed criterion lines that stay inside their own phase.
Part B: Save the graph as a picture file
Choose a vector format when you can. Vector files store lines and text as shapes, so they stay sharp at any size and are what most journals prefer for line art.
- Open Save as Picture. Click the grouped figure once so the whole group is selected, not a single tier. WindowsRight-click the chart's outer edgethe grouped figure's outer edge and choose Save as Picture. MacControl-click the chart's outer edgethe grouped figure's outer edge and choose Save as Picture.
- Pick a format in Save as type.
Format Use it for Scalable Vector Graphics (.svg) Vector. Sharp at any size; good for journals that accept SVG and for websites and slides. Enhanced Windows Metafile (.emf) Vector. Inserts cleanly into Word and PowerPoint on Windows. Tag Image File Format (.tif) Image. Use when a journal asks for TIFF. Portable Network Graphics (.png) Image. Fine for posters, slides, and course work. Format Use it for PDF Vector. Widely accepted by journals for figures. SVG Vector. Sharp at any size; good for websites and slides. PNG Image. Fine for posters, slides, and course work. - Name the file and save. Use a name that matches the manuscript, such as Figure 1.svg. Turning it in for a class? Put your last name and the graph type in the name, such as Lastname ABReversalMultiple BaselineAlternating TreatmentsFunctional AnalysisChanging Criterion Figure 1.png, unless your instructor asks for a different name or format (see class assignments).
Check your journal's figure requirements. Many journals ask for vector files (PDF, EPS, or SVG) or high-resolution TIFF for line art, often 600 dpi or more at final size. An image file saved from Excel is only as detailed as the chart on screen. If a journal requires a high-resolution TIFF, export a vector file first and convert it, or ask the journal's production team which vector format they accept.
Part C: Put the figure in your manuscript
- Insert the picture file. In Word, choose Insert›Pictures›This DeviceInsert›Pictures›Picture from File, select the file you saved, and click Insert. A picture can't change by accident, which a linked Excel chart can.
- Or paste as a picture. Copy the chartgrouped figure in Excel. In Word, use Home›Paste ▾›Paste Special›Picture (Enhanced Metafile)Edit›Paste Special and choose a picture format such as PDF. Avoid a plain paste (Ctrl+V⌘+V). By default it gives you a live Excel chart that stays linked to your workbook and takes on Word’s theme. Its fonts or colors can shift, the figure can change when the workbook is edited, and the link can break when the file is moved.
- Add the figure number and title above, and the note below. Follow the APA layout shown below.
Figure 1
Percentage of Intervals On Task Across Baseline and Token Economy Phases
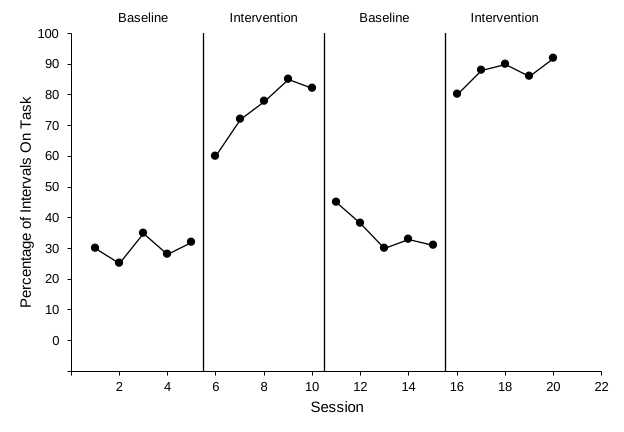
Note. Data are percentages of 10-s intervals with on-task behavior for one participant. Baseline = no programmed consequences; Intervention = token economy.
- Figure number: bold, on its own line above the figure (Figure 1).
- Title: one double-spaced line below the number, in italic title case.
- Note: below the figure. Start with Note. in italics and explain abbreviations, measures, or anything not obvious from the graph.
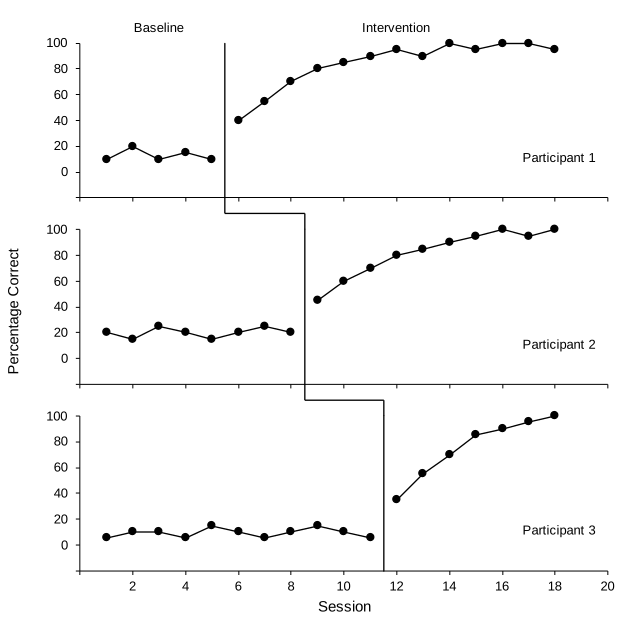
- One figure, all tiers: place the whole grouped figure from Lesson 5, not the single tier from Lessons 1–4. The tier names (Participant 1, 2, and 3) sit inside the panels, so the note does not need to explain them.
- Legend: keep it inside the graph. Because it names Treatment A and Treatment B, the note does not need to explain the markers.
- Criterion lines: say in the note what the dashed lines show, as the example does.
- No title inside the graph. The title belongs in the manuscript text, so remove Excel's chart title (Lesson 3).
- Refer to every figure in the text, and number figures in the order you first mention them.
Part D: Add alt text
- Open alt text. Right-click the picture (in Word) or the chartgrouped figure (in Excel) and choose View Alt Text or Edit Alt Text. Control-click the picture (in Word) or the chartgrouped figure (in Excel) and choose Edit Alt Text.
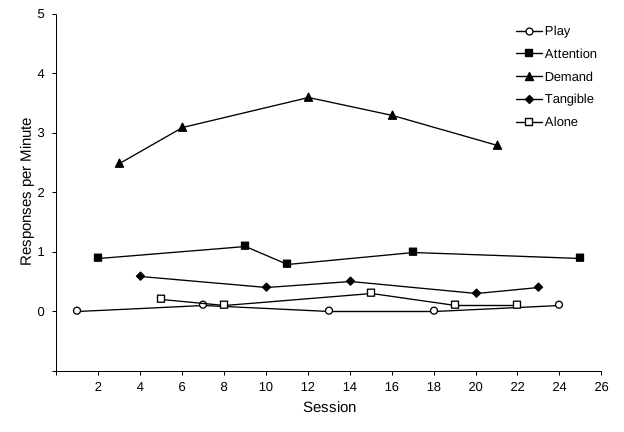
- Describe the finding, not the decoration. For example: "Reversal graph of on-task behavior. On-task behavior was low in both baseline phases (25% to 45% of intervals) and high in both token economy phases (60% to 92%). It rose each time the token economy began and fell when it was withdrawn.""AB graph of problem behavior. Problem behavior occurred in 48% to 66% of intervals during baseline and decreased during intervention, from 40% in the first intervention session to 5% in the last.""Multiple baseline graph of correct responses for three participants. Baseline scores were 25% or lower for every participant. Accuracy rose only after intervention began for that participant, after sessions 5, 8, and 11, and reached 95% to 100% by the last sessions.""Alternating treatments graph of responses per minute. Responding was 1.9 to 2.5 per minute in baseline. When the two treatments alternated, Treatment A decreased from 1.2 to 0.2 per minute, while Treatment B stayed between 1.6 and 2.0.""Multielement functional analysis graph of responses per minute in five conditions. Responding was highest in the Demand condition (2.5 to 3.6 per minute), near 1 per minute in Attention, and 0.6 per minute or lower in Tangible, Alone, and Play.""Changing criterion graph of minutes of exercise. Exercise was 7 to 10 minutes per session in baseline. In each of the five criterion phases (12, 20, 16, 26, then 30 minutes), including the step back down to 16 minutes, it stayed within 1 minute of the criterion in effect." Name the graph type, the behavior, and the pattern a reader should see. Leave out formatting such as fonts, line weights, and tick marks.
Practice
Each graph has one problem, or none. Find it before a reviewer does. The same set is on the Visual analysis practice page, and your progress carries over.
You finished the Excel lessons. Next, try Build it with AI to have Claude or ChatGPT build these graphs inside Excel, or learn to read graphs in Visual analysis.