

Overview › Design guide › Reversal
Reversal (ABAB) design
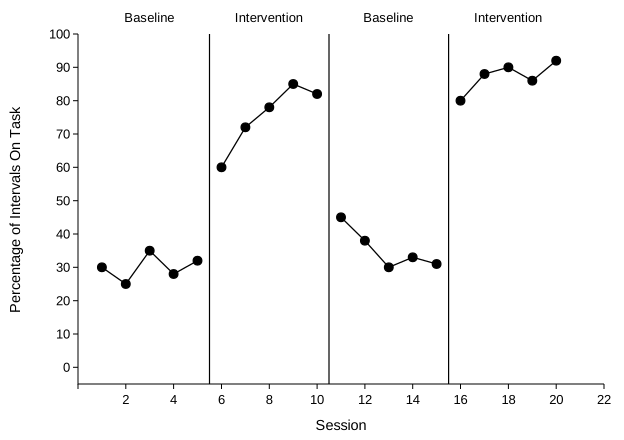
Introduce the intervention, withdraw it, and introduce it again. If behavior changes every time, the intervention is the most likely cause.
You will be able to
- Explain how the four phases of an ABAB design give prediction, affirmation, verification, and replication.
- Check a reversal design against the minimum phases and data points per phase in the WWC pilot standards.
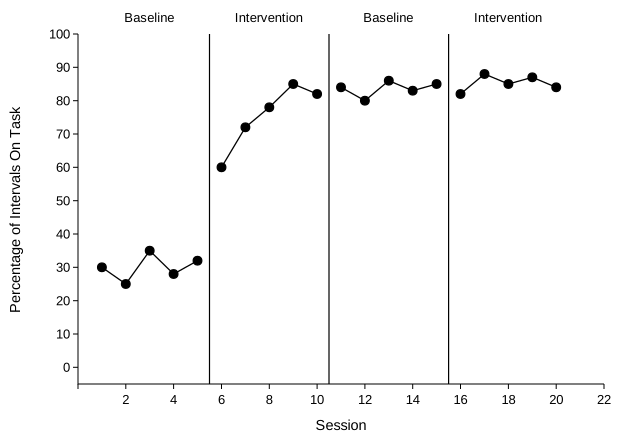
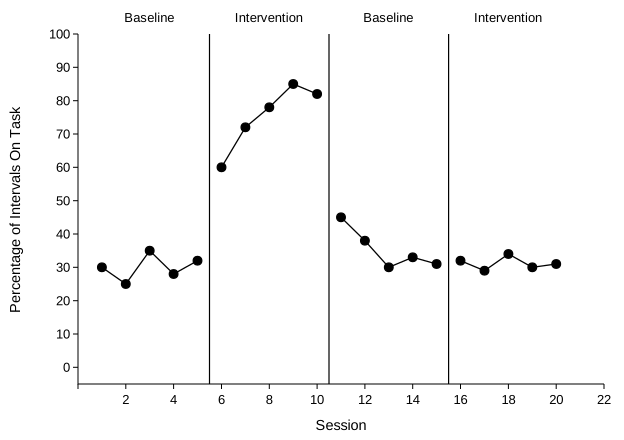
- Decide whether reversal graphs show experimental control, and say why when they don't, reaching 8 of your last 10 in the practice.
How it shows control
Each phase plays a role in baseline logic. The first baseline predicts what would happen without intervention. The first intervention phase shows behavior departing from that prediction. That is affirmation of the consequent: if the intervention controls the behavior, behavior should change when it starts, and it did. On its own, that proves little, because something else could have changed at the same time. Returning to baseline verifies the prediction: if behavior goes back, the first baseline was an accurate forecast. Reintroducing the intervention replicates the effect. The result is three demonstrations of the effect at three points in time.
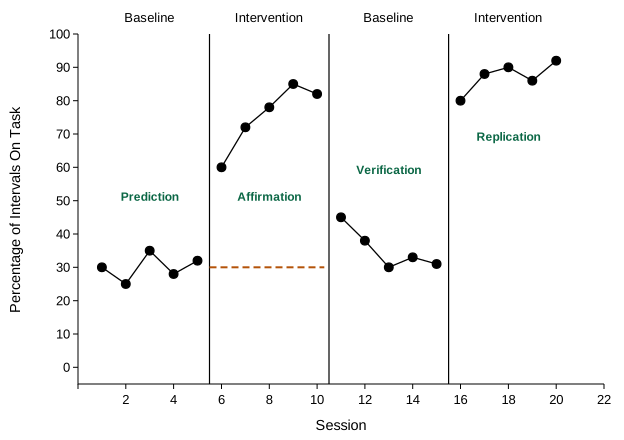
The logic of this design in more depth, its judgment calls and exceptions, and a knowledge check: Visual analysis Lesson 3, Part B.
Minimum standards
- At least four phases (ABAB), giving three attempts to demonstrate the effect.
- At least 5 data points per phase to meet the WWC pilot standards, or 3 per phase to meet them with reservations.
- ABA and BAB designs don't meet the standard. Each provides fewer than three demonstrations.
What experimental control looks like
What it doesn't look like
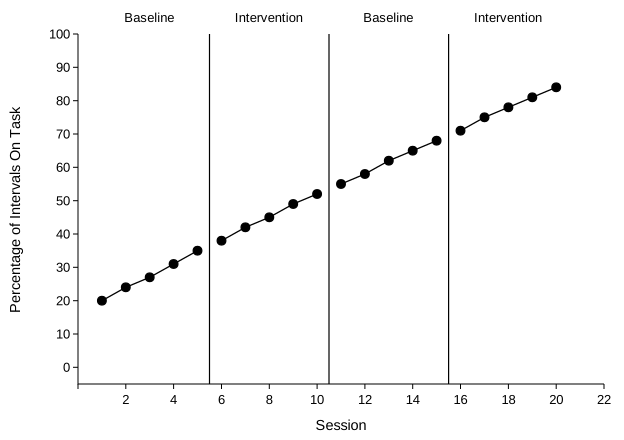
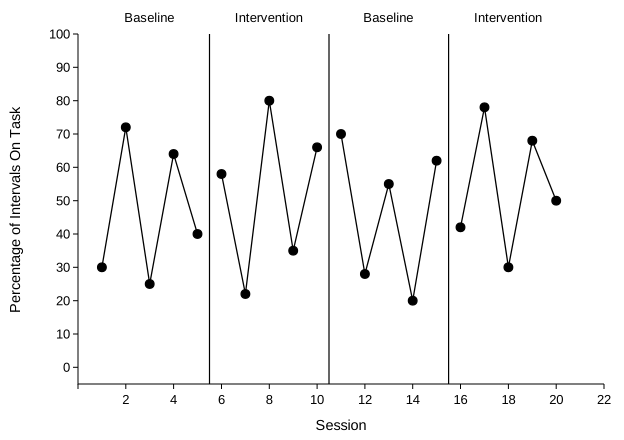
Variations. An A-B-A-B-A-B design adds more replications. To test a second treatment, give it its own reversal, for example A-B-A-B-A-C-A-C, so each treatment is compared with baseline three times. Treatments in adjacent phases, as in A-B-A-B-C-B-C, can be compared with each other directly, but the earlier treatment can change how behavior responds to the later one (multiple-treatment interference), so counterbalance the order across participants when you can. A B-A-B design starts with treatment, so it lacks a true baseline and, like A-B-A, gives only two demonstrations.
Practice
Decide whether each graph shows experimental control. When it doesn't, also choose why. An item counts only when both answers are right.
Graph it
- Template: reversal-abab.xlsx (all templates)
- Build it by hand: Excel Lessons 1–4
- Build it with AI: the matching prompt