

Overview › Build it in Google Sheets › Lesson 4
Phase-change lines and labels
Add the vertical lines that separate phases and the labels that name them. Both come from a few helper rows that you type under your data, so they stay exactly in place when the chart changes. Your alternating treatments graph also gets a label beside each treatment's path. Your changing criterion graph also gets a dashed line at each criterion level.A multielement graph has no phases, so it needs no phase-change lines and no phase labels. Instead, you add a legend that names each condition.
You will be able to
- Type helper rows under your data that draw each phase-change line halfway between two sessions, from the bottom of the vertical axis to the top of the data.
- Label each phase with data labels that take their text from cells, in a band at the top of the plot.
- Name the two treatments with labels beside their paths instead of a legend.
- Add a dashed criterion line for each subphase that spans only that subphase.
- Explain why a multielement graph has no phase-change lines or phase labels.
- Add a legend that names each condition and shows its point shape.
Why build the lines from numbers? A line drawn on top of a chart floats free of it. Change the axis, resize the chart, or copy it, and a drawn line drifts away from the gap between sessions. A line built from numbers in cells is placed by the chart itself, at session 5.5, so it can’t drift. The labels work the same way.
A legend instead of phase lines and labels
A multielement graph has no phases. The conditions alternate from the first session to the last, so there is no point where one phase ends and the next begins, and no phase for a label to name. Skip the phase-change lines and phase labels, and add no helper rows. Instead, bring back the legend that names each condition and shows its point shape.
- Put the legend inside the plot. Open the chart editor (the chart's three-dot menu › Edit chart), click Customize, and open Legend. Set Position to Inside. The legend runs in one row across the top of the plot, above the highest point, and lists your five conditions, Play, Attention, Demand, Tangible, and Alone, each with its point shape. If it covers a point in your own data, raise the vertical axis Maximum by one step.
- Make its text black. In the same section, set Text color to black.
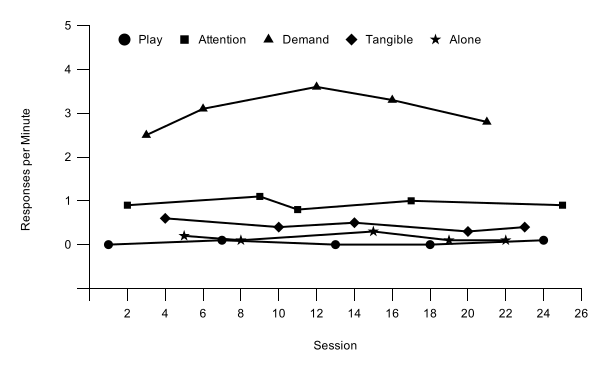
Why a legend? In a multielement graph every condition's path runs across the whole graph, so there is no phase to write a name over. The legend is what lets a reader match each path to its condition. That works only if every condition's point shape can be told apart in black and white. Google Sheets has no open points, so the practice graph gives each of its five conditions its own shape (Lesson 3). The legend lists the conditions in the order of their columns, with the control condition, Play, first.
Part A: Helper rows and phase-change lines
A Google Sheets chart takes the horizontal position of every point from one column, column A. So the helper points that draw the lines and labels go in rows under your data: column A holds each point's position along the session axis, and each kind of helper gets its own column, right after your data (after Participant 3's columns, so columns H, I, and J). Your helper rows start in row 23, one blank row below the data, and use columns F, G, and H.
| A | F | G | H | |
|---|---|---|---|---|
| 23 | 5.5 | -10 | ||
| 24 | 5.5 | 100 | ||
| 25 | 5.5 | |||
| 26 | 10.5 | -10 | ||
| 27 | 10.5 | 100 | ||
| 28 | 10.5 | |||
| 29 | 15.5 | -10 | ||
| 30 | 15.5 | 100 | ||
| 31 | 3 | 105 | Baseline | |
| 32 | 8 | 105 | Intervention | |
| 33 | 13 | 105 | Baseline | |
| 34 | 18 | 105 | Intervention |
How the rows work:
- Each phase-change line is two rows with the same position in column A, halfway between two sessions (5.5). In Phase lines, the first row holds the vertical axis minimum (−10, where the horizontal axis is) and the second the top of the data (100).
- A separator row comes between two lines: the same position in column A, with Phase lines left empty. The empty cell breaks the line, so the chart doesn't join the top of one line to the bottom of the next.
- Each phase label is one row: column A is the middle of the phase, Phase labels is 105, halfway up a band you add above the data in Part B, and Label text holds the words.
- Two more label rows name the treatments beside their paths: Treatment A and Treatment B, with their positions in column A and Phase labels (Treatment A at 11 and 0.85, Treatment B at 8.5 and 2.15), each just above its own path and clear of the other.
- The Criterion rows draw the dashed criterion lines. Dashed criterion lines, below, explains them.
Every helper row needs a number in column A. A row with nothing in column A is skipped, and the line runs on diagonally to the next point. A row with a number in column A but an empty helper cell breaks the line, which is what the separator rows are for.
- Type the helper headings in row 1. Type Phase lines in F1, Phase labels in G1, and Label text in H1, and Criterion in K1. These become the series names.
- Type the helper rows. Leave the row right under your data empty. Starting in row 23, type the rows shown above: the positions in column A and the values in columns F, G, and H, ending in row 34. The bottom of each line (−10) must equal the vertical axis minimum and its top (100) the maximum you set in Lesson 3, so the line meets the horizontal axis and reaches the top of the data. If the chart covers any of these cells, drag it aside first, as in Lesson 2, step 6.
- Point the chart at the helper rows. Open the chart editor (the chart's three-dot menu › Edit chart) on its Setup tab. Click the Data range box, replace what is there with A1:H34, and press Enter. Typing under the data may already have stretched the range down, but Sheets never adds new columns as series by itself, so the chart doesn't change yet. Your range has two parts, separated by a comma, so that Participants 2 and 3 (columns D to G) stay out of this chart. If a Combine ranges setting appears, leave it on Horizontally. If your two data series disappear from the list, add them back with Add Series (P1 Baseline, then P1 Intervention) before the helper series, and check that they are still black with points.
- Add the phase-change lines. Under the list of series in the Setup tab, click Add Series and choose Phase lines. Sheets draws the linesthe line in a new color, from the horizontal axis to the top of the data.
- Format the linesthe line. Click Customize, open Series, and choose Phase lines in the list at the top. Set Line color to black and Line thickness to 1px. Leave Point size on None.
Dashed criterion lines
A changing criterion graph also shows the criterion in effect during each subphase as a dashed horizontal line. Each criterion line is two rows at the end of your helper rows (K46:K59): column A runs from the phase-change line before the subphase to the one after it, and Criterion holds the criterion twice, so the line spans exactly that subphase. The last line ends half a session after the last session. A separator row, with a position in column A and Criterion left empty, comes between two lines.
- Add the criterion series. In the Setup tab, click Add Series and choose Criterion.
- Make it dashed. In Customize›Series, choose Criterion. Set Line color to black, Line dash type to the dashed line (the third item in the list), and Line thickness to 1px.
Changed the vertical axis? The helper numbers must match it. If you change the minimum, type the new minimum as the bottom of each phase-change line. If you change the maximum for the data, change the top of each line too, and keep the label band from Part B one whole step tall, with the labels halfway up it. Lesson 5 changes the bounds for short tiers and walks you through both updates.
Solid or dashed? Both appear in published single-case graphs. A common convention, taught in widely used behavior analysis textbooks, is to use solid lines for changes between conditions and dashed lines for smaller changes within a condition. Examples are a new criterion in a changing criterion design, or a parameter change within the same intervention. These lessons use one rule everywhere: every phase change, including each new criterion in a changing criterion design, gets a solid vertical line, and only the horizontal criterion lines are dashed. If your instructor or target journal follows the textbook convention, dash the vertical lines between criterion subphases instead. Whatever you choose, use it the same way in every figure. To make a line dashed, choose a Line dash type for its series in Customize›Series.
Part B: Phase labels
Each label is a point in the Phase labels column that shows a data label, whose words come from the Label text column. Google Sheets hides any data label that would cross the top edge of the plot, so the labels can’t sit above the plot as they do in Excel. Instead you add a band one step tall at the top of the plot and put the labels in it.
- Add the label band. In Customize›Vertical axis, change Max from 100 to 110. Then open Number format, choose Other custom formats, type [>100]"";[<0]"";0, and click Apply. This code shows nothing for numbers above 100 or below 0, and every other number as usual, so the new tick at the top of the band gets no number and the negative label stays hidden.
- Add the labels as a series. In the Setup tab, click Add Series and choose Phase labels. A colored line appears, joining the label points across the top of the band. Step 4 hides it. Label text isn't offered as a series, because it holds words, not numbers.
- Take the label words from the cells. In the Setup tab's list of series, click the three-dot menu beside Phase labels and choose Add labels. A LABEL box appears under the series, showing Session. Click it and choose Label text. Each label point now shows its words: Baseline, Intervention, Baseline, and Intervention, then Treatment A and Treatment B.
- Hide the line between the labels. In Customize›Series, choose Phase labels. Click the Line thickness box, type 0, and press Enter. The box reads 0px, the line disappears, and the labels stay.
- Format the labels. Further down in the same series, under Data labels (ticked by Add labels, with Type set to Custom), set Position to Center, Data label font to Arial, and Text color to black. The label font starts as Roboto, unlike the rest of the chart, so don't skip it.
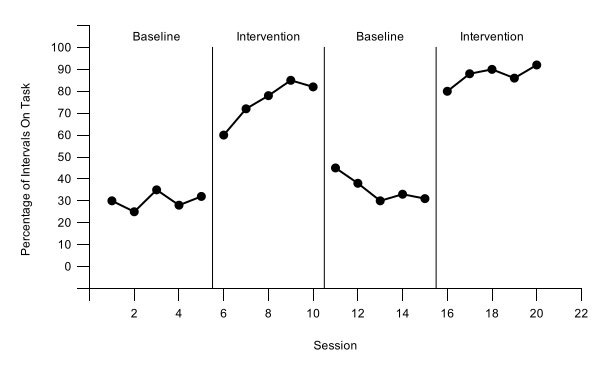
Why the labels sit inside the plot. Google Sheets hides a data label that would cross the plot's top edge, so it can’t put labels above the plot the way Excel and GraphPad Prism can. So the vertical axis runs one step past the data, to 110, the labels sit halfway up that band, at 105, and the number format hides the number at its top. The phase-change lines stop at 100, so the band reads as space above the data. One thing still shows: the vertical axis line runs on to the top of the band, with one unlabeled tick there. Sheets has no way to stop the axis line at the data; the Excel version of this graph doesn’t have that extra tick. Keep the band a whole step tall: with the maximum only part of a step above the data, Sheets hid the labels.
Why labels instead of a legend? A Google Sheets legend lists every series in the chart, and Sheets can’t leave a series out of it, so a legend here would also list Phase lines and Phase labels. APA style allows labeling data paths directly instead of using a legend, so this graph names Treatment A and Treatment B beside their paths, inside the plot. To move a label, change its numbers in column A and the Phase labels column; keep it close to its own path and clear of the other one.
Building a multiple baseline graph? This finishes Participant 1's tier. In Lesson 5 you make it short, copy it for the other participants, give each copy its own phase-change line, and keep the phase labels on the top tier only.
Check before moving on
- The chart's data range is A1:H34, and Setup lists your four data series plus Phase lines and Phase labels and Criterion
- Each phase-change line sitsThe phase-change line sits halfway between two sessions, at 5.5, 10.5, and 15.5, and runs from the horizontal axis to 100: solid black, 1px, no points
- Each dashed criterion line sits at its criterion (12, 20, 16, 26, and 30) and spans only its own subphase: black, 1px, no points
- The vertical axis runs from -10 to 110, with format code [>100]"";[<0]"";0, so no number shows above 100 or below 0 and zero still floats above the horizontal axis
- The phase labels, Baseline, Intervention, Baseline, and Intervention, come from the Label text cells and sit centered over their phases in the band at the top of the plot, with no line joining them
- Label text is Arial and black, each label on one line
- Treatment A and Treatment B are labeled beside their own paths, and the graph has no legend
- The helper columns are H to J, so Participants 2 and 3's data in columns D to G are untouched
- No phase-change lines, no phase labels, and no helper rows
- A legend inside the plot, above the data, lists all five conditions, Play, Attention, Demand, Tangible, and Alone, each with its own point shape, in black text