

Overview › Build it in Google Sheets › Lesson 3
Format for APA style
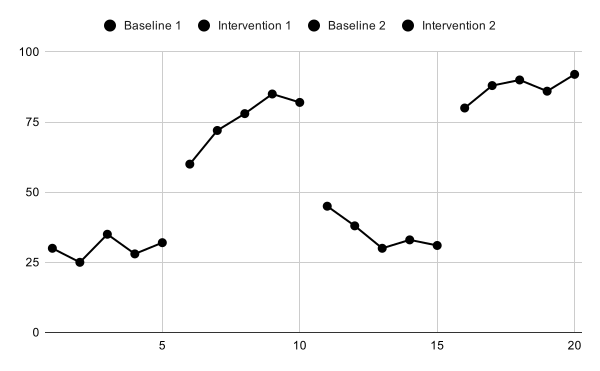
Make the data paths black, remove Google Sheets' extras, then set up both axes and the axis titles in the chart editor. Parts A and D end with a picture of how your chart should look. You are formatting the Participant 1 chart. Lesson 5 copies it for the other tiers, so every setting you make here carries over. For your graph, Part A also joins each condition's points across blank cells and gives each condition its own point shape.
You will be able to
- Make every data path black with points, continuous across blank cells, with a different point shape for each condition.
- Remove the chart border, legend, and gridlines, and add axis titles that name the measure.
- Set the bounds and steps of both axes, with zero floating one step above the horizontal axis and the session 0 label hidden.
The chart editor is your main tool. Click the chart, then click its three-dot menu (at the chart's top right) and choose Edit chart. The chart editor opens on the right. Every setting in this lesson is on its Customize tab, in these sections: Chart style, Chart & axis titles, Series, Legend, Horizontal axis, Vertical axis, and Gridlines and ticks. Click a section's name to open it; opening one closes the one that was open. The chart changes as soon as you change a setting.
You don't need to set a font. The chart's text is Arial unless you change it (Chart style›Font reads Default (Arial)), and text whose color is left on Auto downloads as black.
Part A: Make every data path black
- Connect each condition across its blank cells. Open Chart style and tick Plot null values. Each condition's points now join across the blank cells in its column, so every condition reads as one path. The setting applies to every series in the chart. That is safe here: the Baseline path still ends at the phase change, because its column has no later values, and the phase-change line you add in Lesson 4 is a single line. That is safe here, because a multielement graph has no helper series.
- Make every line black and add points. Open Series. The list at the top of the section reads Apply to all series. Leave it there, set Line color to black (the top-left swatch), and set Point size to 7px. Leave Line thickness on Auto, which draws 2-pixel lines. Every phase now has the same black line and black circles.
- Give each condition its own point shape. Google Sheets has no open (hollow) points, so shape alone tells the conditions apart. In the list at the top of Series, choose one condition at a time and set its Point shape and Point size: Treatment A Square, size 8; Treatment B Triangle, size 9. Baseline stays a 7px circle. Attention Square, size 8; Demand Triangle, size 9; Tangible Diamond, size 9; Alone Star, size 10. Play, the control condition, stays a 7px circle. The Point size list offers only a few sizes, but you can type another number, such as 8 or 9, in its box. Squares, triangles, and the other shapes look smaller than a circle of the same size, so they get a size or two more.
Part B: Remove the border and legend, and add axis titles
- Remove the chart border. Open Chart style, open the Chart border color palette, and choose None at its top.
- Remove the legend. Open Legend and set Position to None. A single-case graph names its phases with labels at the top of the plot instead (Lesson 4). Your graph names the two treatments with labels beside their paths instead (Lesson 4). Your graph needs a legend, but inside the plot, not at the side; you turn it back on there in Lesson 4.
- Add the axis titles. Open Chart & axis titles. In its first list, choose Vertical axis title, then type Percentage of Intervals On Task in the Title text box. Then choose Horizontal axis title in the same list and type Session. Sheets turns the vertical title on its side for you. Leave Chart title empty: the figure title goes in your manuscript, not in the chart (Lesson 7). The list opens lined up on the item that is chosen now, so its items aren't always in the same place. Read the names before you click.
Part C: Format the vertical axis
- Show the axis line and set the bounds. Open Vertical axis. Tick Show axis line. Type -10 in Min and 100 in Max. Allow bounds to hide data ticks itself once you type them; leave it ticked. For your own data, end the vertical axis at 100 for percentages; for other measures, at a step comfortably above your highest value. The practice data are percentages, so the maximum is 100. The practice rates peak at 2.5, so a maximum of 3 keeps the highest point below the top of the plot. The practice rates peak at 3.6, so a maximum of 5 keeps the highest point well below the top of the plot. The practice data peak at 31 minutes, so a maximum of 40 keeps the highest point well below the top of the plot.
- Hide the negative label. Further down in Vertical axis, open the Number format list and choose Other custom formats, at the bottom. In the Custom number formats box, type 0;;0 and click Apply. The “−10” label disappears. The code has three parts, for positive numbers, negative numbers, and zero; the empty middle part shows nothing for negative numbers. Your graph shows a rate, but its axis still counts in whole numbers (0, 1, 2, and so on), so the same code works.
- Set the step, and put the tick marks outside. Open Gridlines and ticks and choose Vertical axis in its list. Set Major spacing type to Step and Major step to 10. Untick Major gridlines; this also removes the darker line Sheets draws at 0. Tick Major ticks and set Ticks position to Outside.
Why a floating zero? If 0 sits right on the horizontal axis, data points at zero merge with the axis line and are hard to see. Behavior-analytic journals have long placed zero slightly above the horizontal axis. The graphs drawn elsewhere on this site raise it by half a step, and GraphPad Prism can too. Google Sheets can’t: with Step spacing it starts its ticks at the axis minimum, as Excel does, so a minimum of half a step below zero would label the ticks 5, 15, 25 instead of 0, 10, 20. In Sheets the minimum has to be exactly one whole step below zero. Here that is -10 with a step of 10, so zero floats one step above the horizontal axis.
Part D: Format the horizontal axis
- Set the step, and put the tick marks outside. In Gridlines and ticks, choose Horizontal axis in the list. Set Major spacing type to Step and Major step to 2. Untick Major gridlines. Tick Major ticks and set Ticks position to Outside.
- Set the bounds and show the axis line. Open Horizontal axis. Set Min to 0. For Max, use one more than your last session, so the last point is not squeezed against the edge of the plot; if that number falls between two tick marks, round up to the next tick. The practice data end at session 20, and one more falls between two ticks, so type 22. Then, lower in the same section, tick Show axis line. Sheets draws no horizontal axis line until you do. For your own data, use a step of 1 with 10 or fewer sessions, and 5 or 10 with more than 40.
- Hide session 0. There is no session 0, so hide that label. Still in Horizontal axis, open Number format, choose Other custom formats, type 0;;, and click Apply. The tick mark stays and the “0” disappears.
- Keep the axis numbers whole. For rates such as responses per minute, count the vertical axis in whole numbers too: a step of 1 (or 2, 5, 10…), not 0.5, with the matching floating zero, a minimum of -1, and the format code 0;;0. The points still plot at their exact rates. Your graph shows a rate, but Part C still counted the vertical axis in whole numbers: a step of 1, a minimum of -1, and the format code 0;;0. The points still plot at their exact rates, such as 0.6 or 2.5; only the axis numbers are whole. Keep the horizontal axis in whole sessions too.
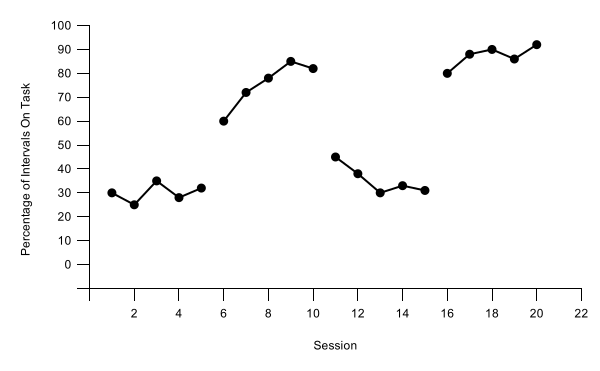
A point at the top is cut in half? A point exactly at the vertical axis maximum is cut in half by the top edge of the plot. The multiple baseline practice data reach 100, so you will see this on Participant 1's chart. Leave it for now: Lesson 4 raises the maximum one step to make room for the phase labels, and that gives the point its full size again.
Check before moving on
- No chart title, legend, gridlines, or chart border
- Every data path is a black line with black circles (point size 7px)Each condition is one continuous black path across its blank cells (Plot null values), with its own point shape: Baseline circles, Treatment A squares, and Treatment B triangles
- Vertical axis -10 to 100 in steps of 10, with the -10 label hidden (format code 0;;0), so zero floats one step above the horizontal axis
- Horizontal axis 0 to 22 in steps of 2, with the 0 label hidden (format code 0;;)
- Both axes show their axis line, with tick marks outside
- Both axis titles are present and in title case: Session and Percentage of Intervals On Task
- All text is Arial and black, as Sheets sets it
- The chart is still Sheets' default size, 600 × 371 pixels