

Overview › Design guide › Multiple baseline
Multiple baseline and multiple probe designs
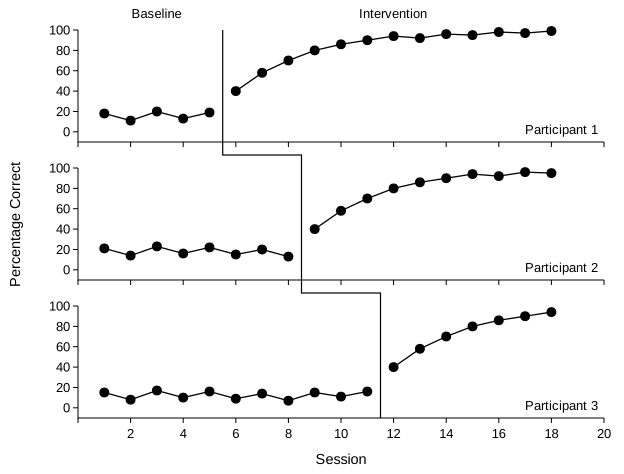
Start the intervention at different times across three or more participants, behaviors, or settings. If each one changes only when its own intervention begins, the intervention is responsible.
You will be able to
- Explain how staggered starts across three or more tiers give three demonstrations of the effect.
- Check a multiple baseline or multiple probe design against the WWC minimums and the probe rules.
- Decide whether multiple baseline graphs show experimental control, and say why when they don't, reaching 8 of your last 10 in the practice.
How it shows control
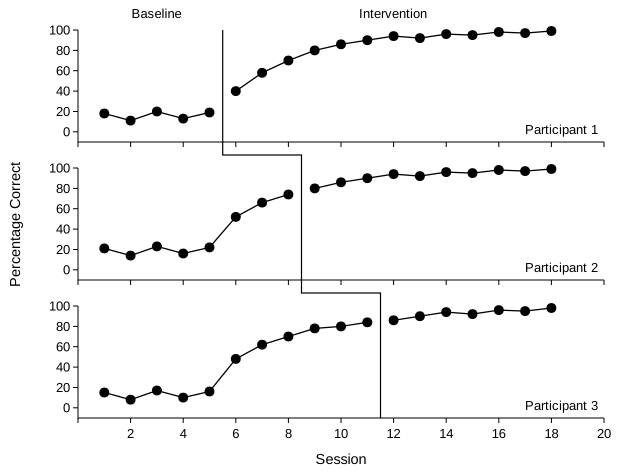
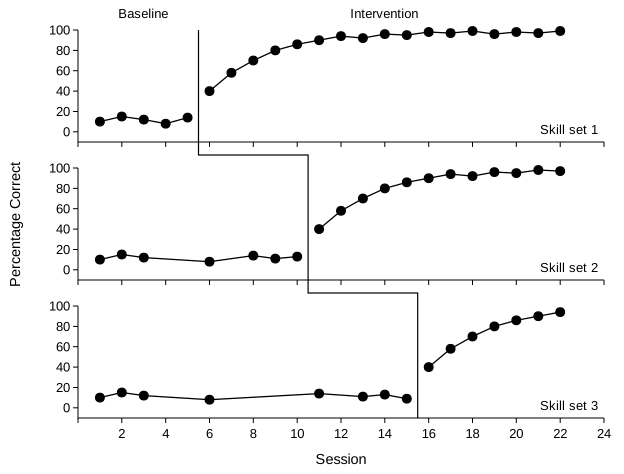
All tiers start in baseline together. When the first tier begins intervention, the tiers still in baseline act as controls. If they stay stable while the first tier changes, that verifies that time alone isn't producing change. Each staggered start then replicates the effect. Three tiers give three demonstrations at three different times.
The logic of this design in more depth, its judgment calls and exceptions, and a knowledge check: Visual analysis Lesson 3, Part C.
Minimum standards
- At least three tiers (six phases), with intervention starting at three different times.
- At least 5 data points per phase to meet the WWC pilot standards, or 3 per phase to meet them with reservations.
- Prefer concurrent tiers, measured over the same calendar time. A nonconcurrent design, with participants enrolled at different times, is weaker at ruling out outside events, and some reviewers and standards don't accept it as showing a functional relation.
What experimental control looks like
What it doesn't look like
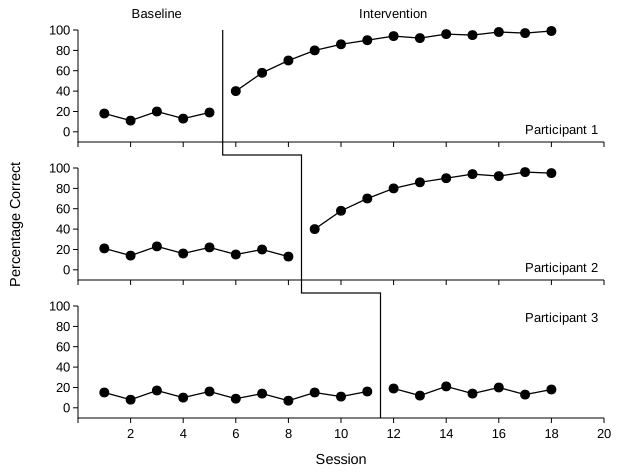
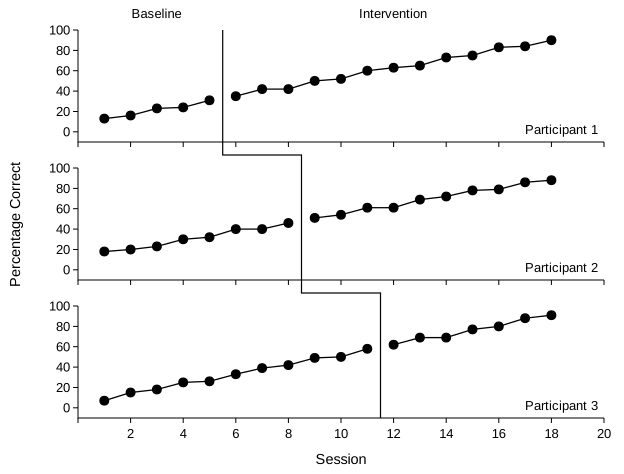
Multiple probe design
When measuring every tier in every session is impractical or reactive, use intermittent probes in baseline. Reactive means testing itself teaches or tires the participant. Before a tier begins intervention, it gets several consecutive probes. These show that its baseline is still stable at the moment the intervention starts. The logic of control is the same as for a multiple baseline (Horner & Baer, 1978).
Minimum standards for multiple probe
The 2010 WWC pilot standards don't mention multiple probe designs. A later WWC handbook added three probe rules on top of the multiple baseline minimums (What Works Clearinghouse, 2017, pp. A-5 to A-6):
- Every tier is probed in each of the first three sessions, so all the baselines start together.
- Every tier still in baseline is probed in the session when another tier starts intervention (or reaches its criterion), to check that the waiting tiers didn't change too.
- Each tier gets three consecutive probes just before its own intervention starts.
If a tier has at least one probe in each of those three-session windows, but not three in a row, the study can still meet the standards with reservations. A study that has no probe in one of those windows, or skips the probe when another tier starts, does not meet them.
Practice
Decide whether each graph shows experimental control. When it doesn't, also choose why. An item counts only when both answers are right.
Graph it
- Template: multiple-baseline.xlsx (all templates)
- Build it by hand: Excel Lessons 1–5 (Excel Lesson 5 stacks the tiers)
- Build it with AI: the matching prompt