

Overview › Build it with AI › Lesson 4
Multiple baseline graphs with AI
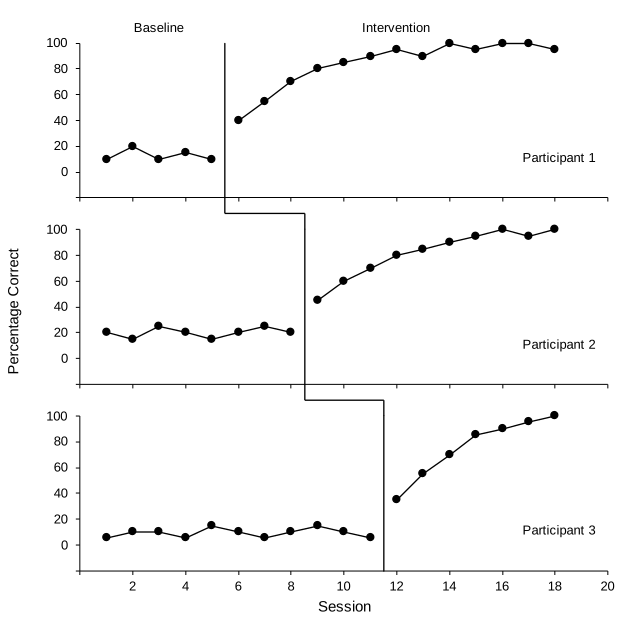
A multiple baseline figure is several charts lined up exactly, plus connector lines in the gaps between them. That precise layout is where AI assistants are least reliable. So the recommended route is to let the template handle the layout and let the AI handle your data.
You will be able to
- Fill the multiple baseline template with your data using a prompt, and realign the connector lines between tiers.
- Build a three-tier figure from scratch with a prompt when you can't use the template.
- Check that the tiers line up and that the stepped line meets each tier's phase-change line.
Route A (recommended): template + AI
- Download the template. Get multiple-baseline.xlsx and open it.
- Bring in your data. Paste your de-identified data on a new sheet named My data, in whatever layout you have.
- Ask the assistant to fill the template. Use the prompt below. The tiers, phase-change lines, and labels update from the yellow cells automatically. If your last session is past 19, widen the horizontal axis on all three tiers (Format Axis › Maximum), and type the same maximum in the yellow X-axis maximum cell under Settings so the tier names stay at the right edge.
- Nudge the connectors if needed. If your intervention start points differ from the example, the six short connector lines between tiers need to move to meet the new phase-change lines. Ask the assistant (second prompt), or drag them yourself as in Excel Lesson 5. While a tier is still in baseline, its phase-change line stays hidden, but the connectors do not: hide the ones leading to that tier (click one, then Shape Format › Selection Pane, and click the eye icon) until its intervention begins.
Before you send a prompt, edit its bracketed, underlined parts to match your data. The brackets only mark what to edit; they are not copied with the prompt.
This workbook is a multiple baseline graph template. On the "Graph" sheet, columns B to G hold data in pairs (Baseline, Intervention) for three tiers, with sessions in column A. Yellow cells are inputs; grey cells are formulas.

My data are on the "My data" sheet. Column A is session, column B is participant ID, column C is phase (Baseline or Intervention), column D is the percentage correct.

1. Clear the example values in Graph!B5:G44 (values only; keep formatting).
2. Copy my data into the template: for each participant, put each session's value in that tier's Baseline or Intervention column, on the row for that session number. Leave all other cells empty.
3. Put the participant IDs in the yellow Tier names cells, in this order: P1, P2, P3.
4. Do not change any formulas, charts, or shapes yet.
5. Tell me the last baseline session and first intervention session for each tier, and the largest session number.
On the Graph sheet, the grouped figure "Multiple baseline figure" contains three charts (Tier 1 to Tier 3) and six line shapes named "Connector 1.1" to "Connector 2.3". Each tier chart has a vertical phase-change line series named "Phase change".

Move the connector shapes so they form a stepped line: Connector t.1 runs straight down from the bottom of tier t's phase-change line to halfway into the gap below; Connector t.2 runs horizontally from there to directly above tier t+1's phase-change line; Connector t.3 runs straight down to the top of tier t+1's phase-change line. Compute positions from each chart's position and plot area. Keep them black, 1 pt. Report the positions you used.
Check the connector ends at 200% zoom. If they're slightly off, select a connector and nudge it with the arrow keys. That is usually faster than another prompt.
Route B: from scratch
If you can't use the template, this prompt builds the whole figure. Expect to check alignment and the connectors carefully.
Build a publication-ready, APA-style multiple baseline graph from this sheet. Don't change my data cells.

THE DATA: Column A is Session. Then two columns per tier: B-C = Participant 1 (Baseline, Intervention), D-E = Participant 2, F-G = Participant 3. Each value appears only in its phase's column.

TIERS
1. Make one native X Y (scatter, straight lines and markers) chart per tier. Each tier has its Baseline and Intervention columns as two series, with column A as X values for both.
2. Every tier: width 6.5 in; the same horizontal axis, min 0, max 20 (the first multiple of the major unit after the last session of any participant), major unit 2, with the 0 label hidden (number format 0;;); the same vertical axis, min -20, max 100, major unit 20, negative label hidden with number format 0;;0, horizontal axis crossing at the minimum; black 0.75 pt axis lines, outside tick marks, no gridlines, no legend, no chart title, no borders, Arial black text (10 pt ticks, 11 pt titles), black 1 pt lines with black size-6 circle markers.
3. Top tier: 2.2 in tall, with the extra 0.2 in (14 pt) above its plot area, so the phase labels sit above the plot area and every tier's plot area is the same height. Middle tier: 2 in tall. Top and middle tiers: no horizontal tick labels and no horizontal axis title. Bottom tier: 2.4 in tall, with tick labels and the title "Session".
4. Give every tier a vertical axis title so plot areas line up, but use a single space as the text on the top and bottom tiers. On the middle tier use "Percentage Correct".
5. Stack the tiers directly below each other with left edges aligned, and make sure the plot areas (the axes) line up exactly.

PHASE-CHANGE LINES AND LABELS
6. Give each tier its own phase-change line as a two-point series from a helper table: X = halfway between that tier's last baseline and first intervention session (formula), Y from the vertical axis minimum to its maximum. Black 1 pt, no markers.
7. On the top tier only, add phase labels "Baseline" and "Intervention" as a helper series with data labels from cells, centered over each phase, above the points, so they sit above the top tier's plot area.
8. Put the tier name (Participant 1, 2, 3) inside each tier near the bottom-right, Arial 10 pt.

CONNECTORS
9. Draw line shapes on the worksheet (not inside a chart) forming a stepped line from the bottom of each tier's phase-change line down, across, and down to the top of the next tier's phase-change line. Black 1 pt.
10. Group the three charts and all connector lines into one object.

Finally, list what you added and anything you could not do exactly.
Check it
- The vertical axis lines of all tiers form one straight vertical line
- All tiers share the same horizontal range, so session 10 sits at the same spot in every tier
- Each tier's phase-change line falls at that tier's own phase change
- The stepped connector meets each phase-change line, with no gaps or overshoot at 200% zoom
- Phase labels appear above the top tier's plot area only; session numbers and "Session" appear on the bottom tier only
- Run the audit prompt for the formatting items