

Overview › Build it with AI › Lesson 3
Check and fix the result
Check every AI-built graph in two passes. First, ask the assistant to audit its own chart against a written list. Then look at the graph yourself. Fix what's wrong with a targeted follow-up prompt, or by hand when that's faster.
You will be able to
- Run an audit prompt that has the assistant check its chart's actual settings, and have it fix every item that fails.
- Compare the chart with the target graph and score it with the self-review checklist.
- Decide whether to fix each mistake with a follow-up prompt or by hand.
Instructions for: The target picture, the checks, and the list of common mistakes below follow the graph you choose.
Pass 1: the audit prompt
Send this in the same conversation, right after the assistant finishes. Asking it to check the chart's actual settings works better than asking whether the graph "looks right." The same audit works for every graph type: items about parts your graph doesn't have, such as criterion lines, come back N/A.
Audit the chart you just made by reading its actual settings, not from memory. For each item, answer PASS or FAIL with the value you found. Answer N/A for any part of the graph I did not ask for.

1. Chart type is X Y scatter with straight lines and markers.
2. Every phase or condition is a separate series, all using the Session column as X values.
3. No data path connects the last point of one phase to the first point of the next.
4. No chart title, no gridlines, no chart-area border. No legend, unless I asked for one; then it lists only the series I named, sits inside the plot area, and has no border.
5. Axis minimums, maximums, and major units match what I asked for. The vertical minimum is exactly one major unit below 0, its negative label is hidden, and the horizontal axis crosses at that minimum.
6. Both axes are solid black 0.75 pt lines with outside major tick marks.
7. All text is Arial, black, not bold (11 pt axis titles, 10 pt for all other text).
8. All data series are black 1 pt lines with black size-6 markers, in the marker shapes and fills I asked for.
9. If I asked for empty cells to be connected, each condition is one continuous path, and no path drops to zero at sessions when that condition was not run.
10. Phase-change lines are chart series (not shapes) at the halfway points, running from the vertical axis minimum to its maximum.
11. Criterion lines are dashed chart series (not shapes), each at its criterion and spanning only its own phase.
12. Phase labels are data labels taken from cells (part of the chart, not text boxes), centered over each phase, above the plot area: no label overlaps the plot area or the top of the vertical axis.
13. None of my original data cells were changed.

Then fix every FAIL and run the audit again.
Pass 2: look at it yourself
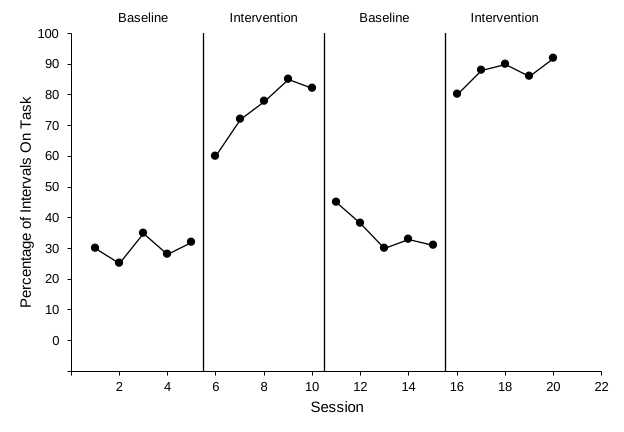
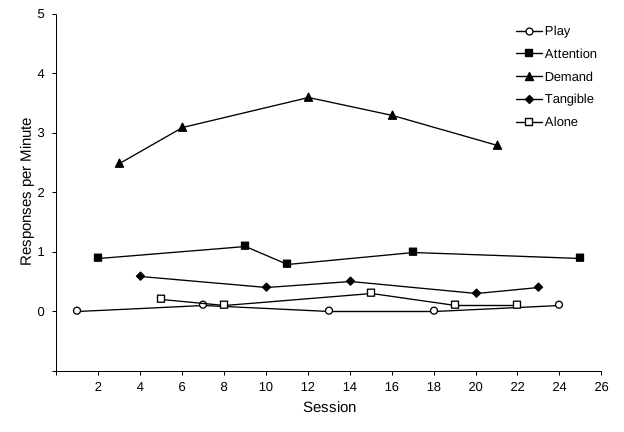
Put the target picture next to the assistant's chart and compare them. Then score it with the self-review checklist.
- Spot-check three data points: hover over a marker and compare its value with the worksheet
- Each phase-change line sits between the last session of one phase and the first of the next
- Phase-change lines run from the horizontal axis to the top of the plot without changing the axis range
- Each dashed criterion line sits at its criterion and spans only its own phase
- Each condition is one continuous path, and no path drops to zero at sessions when that condition was not run
- Each condition has its own black-and-white marker
- Zero floats one tick above the horizontal axis, and the tick labels are round numbers
- Labels sit above the plot area, are readable, and don't overlap each other
- Labels are readable, centered over their phases, and don't overlap each other
- Labels sit above the plot area, and labels and legend are readable and don't overlap data or each other
- The legend is readable, sits inside the plot, and doesn't overlap the data
- Nothing is in color
Common mistakes and the follow-up prompt for each
| What you see | Send this | Or fix by hand |
|---|---|---|
| Phases or conditions joined by one continuous line | "Each phase or condition must be a separate series using its own column, with column A as X values. Rebuild the series that way." | Excel Lesson 1 |
| A line chart with evenly spaced text categories | "Change the chart type to X Y scatter with straight lines and markers, keeping column A as the X values for every series." | Excel Lesson 2 |
| Colors, gridlines, a chart title, or an unwanted legend | "Make every series black (line and markers), and remove the chart title and all gridlines. Remove the legend too, unless I asked for one." | Excel Lesson 3, Part A |
| A condition shows as scattered points, or its path drops to zero at sessions when it was not run | "Set the chart's hidden and empty cells option to Connect data points with line. Do not put zeros in the empty cells." | Excel Lesson 6 |
| Phase-change lines are drawn shapes, or slightly off | "Delete the drawn lines. Add each phase change as a two-point scatter series from a helper table, X at the halfway point, Y from the vertical axis minimum to its maximum." | Excel Lesson 4, Part A |
| Phase-change lines stop short of the axes, or the axis range changed | "Set the vertical axis minimum and maximum back to the values in my prompt, and make each phase-change line run from that minimum to that maximum." | Excel Lesson 4 |
| Criterion lines are solid, drawn as shapes, or run across the whole graph | "Make each criterion line a two-point series from a helper table, from half a session before its phase's first session to half a session after its last, at that phase's criterion. Black 1 pt dashed, no markers." | Excel Lesson 6 |
| Phase labels missing, or typed in text boxes | "Replace the labels with one helper series: no line or markers, data labels from the label-text cells, positioned above." | Excel Lesson 4, Part B |
| Phase labels show a number (the Y value) instead of text | "The data labels should show the text from the label cells, not the Y value. Turn off the Y value in the labels." | Format Data Labels › Value From Cells |
| A phase label breaks onto two lines and hangs down into the plot | "Keep each phase label on one line: turn off text wrapping in the data labels." | Excel Lesson 4, Part B |
| Phase labels sit on the top edge of the plot or overlap the highest data | "Lower the top edge of the plot area by about 0.2 in (14 pt), keeping its bottom and sides where they are, so every phase label sits above the plot area." | Excel Lesson 4, Part B, step 7Excel Lesson 5, Part D, step 1 |
| Fonts are Calibri or Aptos, or titles are bold | "Set every text element in the chart to Arial, black, not bold: 11 pt axis titles and 10 pt for all other text." | Excel Lesson 3, Part B |
| Zero sits on the horizontal axis, or tick labels read 5, 15, 25… | "Set the vertical axis minimum to exactly one major unit below 0, hide negative labels with number format 0;;0, keep the labels whole numbers, and make the horizontal axis cross at the minimum." | Excel Lesson 3, Part C |
| Chart is the wrong size | "Resize the chart to 6.5 inches wide by 4.5 inches tall without changing font sizes." | Excel Lesson 2, step 5 |
| Your data were changed or moved | Close without saving and reopen your copy. Then start over with "Do not change cells A1:E21A1:G19" at the top of the prompt. | — |
Know when to stop prompting. If two follow-ups haven't fixed something, fix it by hand. Every setting is covered in the Excel lessons, and a one-click change is often faster than a third prompt. AI is best at the repetitive parts: restructuring data, adding several series, and applying the same formatting to many elements.
Undo works differently with add-ins. Changes made by an add-in may not all reverse with Ctrl+Z / ⌘+Z. The copy you saved before prompting is your real undo.