

Overview › Build it in Excel › Lesson 4
Phase-change lines and labels
Add the vertical lines that separate phases and the labels that name them. Both are built from small tables of numbers, so they stay exactly in place when you resize, copy, or paste the chart. Your alternating treatments graph also gets a legend that names the two treatments. Your changing criterion graph also gets a dashed line at each criterion level.A multielement graph has no phases, so it needs no phase-change lines and no phase labels. Instead, you add a legend inside the plot that names each condition.
You will be able to
- Place each phase-change line halfway between two sessions, built as a two-point series that runs from the vertical axis minimum to its maximum.
- Label each phase above the plot area with data labels that take their text from cells, and lower the top of the plot area to make room for them.
- Label each phase with data labels that take their text from cells, ready to sit above the top tier’s plot area in Lesson 5.
- Add a borderless legend inside the plot that names only the two treatments.
- Add a dashed criterion line for each subphase that spans only that subphase.
- Explain why a multielement graph has no phase-change lines or phase labels.
- Add a borderless legend inside the plot that names each condition and covers no data.
Why not just draw a line? A line drawn with Insert › Shapes floats on top of the chart. Change the axis range, resize the chart, or paste it into Word, and the drawn line drifts away from the gap between sessions. A line built as a data series is positioned by numbers (session 5.5), so it can't drift. The same idea works for labels. This method is widely taught for single-case graphs in Excel. The quick drawn-line method is at the end of this lesson if you only need a rough draft.
A legend instead of phase lines and labels
A multielement graph has no phases. The conditions alternate from the first session to the last, so there is no point where one phase ends and the next begins, and no phase for a label to name. Skip the phase-change lines and phase labels. Instead, add a legend inside the plot that names each condition and shows its marker.
- Add a legend. WindowsClick the chart, click the Chart Elements button (+) beside its top-right corner, and check Legend. MacClick the chart and choose Chart Design›Add Chart Element›Legend›Right. The legend lists your five conditions, Play, Attention, Demand, Tangible, and Alone, each with its own marker.
- Give the plot back its full width. Double-click the legend to open Format Legend. Under Legend Options › Legend Position, uncheck Show the legend without overlapping the chart. The plot area widens again, and the legend now sits on top of it.
- Remove the border. In Format Legend › Fill & Line, set Border to No line and Fill to No fill.
- Drag the legend into the plot area. Drag it by its edge to an empty part of the plot, where it covers no data point or path. For the practice data, the upper right is clear: from session 22 on, every rate is below 1 response per minute.
- Check the legend font. Click the legend and confirm it is Arial 10 pt, black. Set it if not.
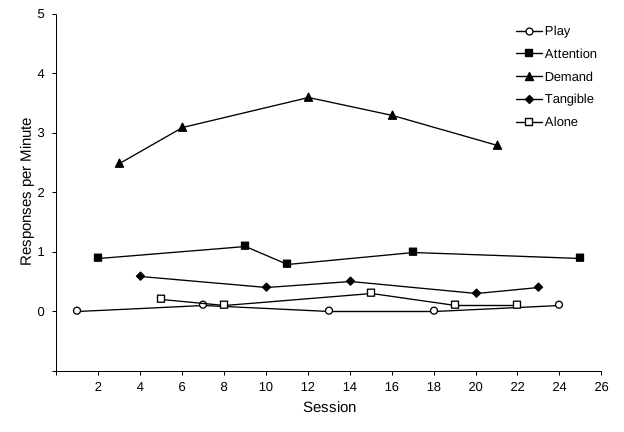
Why a legend? In a multielement graph every condition's path runs across the whole graph, so there is no phase to write a name over. The legend is what lets a reader match each path to its condition. That works only if every condition's marker can be told apart in black and white, by its shape or by being filled or open. In the practice graph, Attention and Alone are both squares, so one is filled and the other open. To label each path directly instead, use a text box (see the quick method).
Part A: Phase-change lines
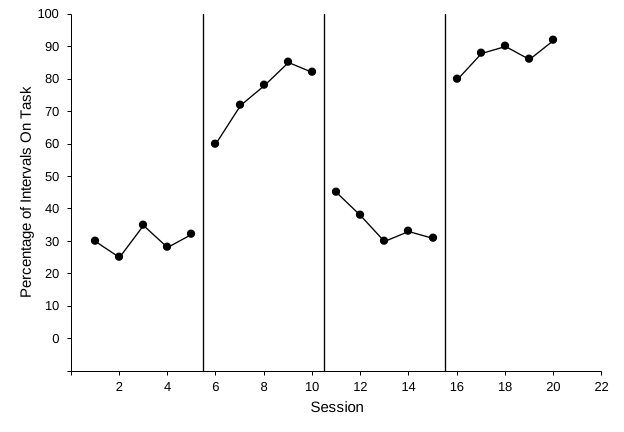
Each phase-change line is a tiny two-point series. Both points share the same x-value, halfway between the last session of one phase and the first session of the next. One point sits at the vertical axis minimum (−10, where the horizontal axis is) and the other at the maximum (100).
| G | H | ||
|---|---|---|---|
| 1 | Line X | Line Y | |
| 2 | 5.5 | -10 | ← line 1, bottom (= axis minimum) |
| 3 | 5.5 | 100 | ← line 1, top (= axis maximum) |
| 4 | 10.5 | -10 | ← line 2 |
| 5 | 10.5 | 100 | |
| 6 | 15.5 | -10 | ← line 3 |
| 7 | 15.5 | 100 |
- Type the helper table. If your chart covers cell G1 or the columns to its right, drag it below your data first, as in Lesson 2, step 4. In G1 and H1 type Line X and Line Y. Fill in the six rows shown above, two for each linetwo rows shown aboveten rows shown above, two for each line. The bottom value in column H must equal your vertical axis minimum (−10) and the top value your maximum (100), so the line meets the horizontal axis and reaches the top of the plot.
- Open Select Data. Click the chart, then go to Chart Design›Select Data.
- Add a new series. WindowsUnder Legend Entries (Series), click Add. The Edit Series box opens. MacUnder the Legend entries (Series) list, click the + button. A new series appears and is selected, with its boxes on the right.
- Point the series at the first line'sthe line's cells.
In Series name (Name), type Phase change. Click in X values, delete anything in it, and drag across G2:G3. Click in Y values, delete the
={1}or other placeholder, and drag across H2:H3. Click OK. - Repeat for the other lines, then close.Close Select Data. Add twofour more series the same way, using G4:G5 / H4:H5 and G6:G7 / H6:H7 (X values / Y values). Your graph has one phase change, so this one line is all it needs. Click OK to close Select Data.
- Format each new linethe new line. Excel draws the new series in color, with markers. Double-click one phase-change linethe phase-change line to open Format Data Series (if the pane is already open, one click is enough). Under Fill & Line › Line, choose Solid line, black, 1 pt. Under Marker › Marker Options, choose None. Repeat for the other two lines. Repeat for the other four lines.
Dashed criterion lines
A changing criterion graph also shows the criterion in effect during each subphase as a dashed horizontal line. Each criterion line is another two-point series. Both points have the criterion as their y-value. The x-values run from the phase-change line before the subphase to the one after it, so the line spans exactly that subphase. The last line ends half a session after the last session.
| P | Q | ||
|---|---|---|---|
| 1 | Criterion X | Criterion Y | |
| 2 | 5.5 | 12 | ← criterion 1, start |
| 3 | 8.5 | 12 | ← criterion 1, end |
| 4 | 8.5 | 20 | ← criterion 2 |
| 5 | 13.5 | 20 | |
| 6 | 13.5 | 16 | ← criterion 3 |
| 7 | 16.5 | 16 | |
| 8 | 16.5 | 26 | ← criterion 4 |
| 9 | 20.5 | 26 | |
| 10 | 20.5 | 30 | ← criterion 5 |
| 11 | 23.5 | 30 |
- Type the criterion table. In P1 and Q1 type Criterion X and Criterion Y. Fill in the rows shown above, two for each of the five criterion lines.
- Add one series per criterion line. Open Chart Design›Select Data and add a series the same way as in steps 3 and 4. Name it Criterion, with X values P2:P3 and Y values Q2:Q3. Add a series for each of the other criterion lines the same way, using P4:P5 / Q4:Q5, P6:P7 / Q6:Q7, P8:P9 / Q8:Q9, and P10:P11 / Q10:Q11 (X values / Y values). Click OK to close Select Data.
- Make the criterion lines dashed. Double-click one criterion line to open Format Data Series. Under Fill & Line › Line, choose Solid line, black, 1 pt. (Solid line sets one solid color; the dashes come next.) Open Dash type and choose a dashed style, such as Dash. Under Marker › Marker Options, choose None. Repeat for each of the other criterion lines.
Let Excel find the halfway point. Instead of typing 5.5 in the Line X cells, use a formula. It updates when you add sessions to a phase. For the line between Baseline 1 (column B) and Intervention 1 (column C):For the line between Baseline (column B) and the alternating phase, which starts with whichever treatment ran first (column C or D):
=(MAXIFS($A$2:$A$41, B$2:B$41, ">-1E+300") + MINIFS($A$2:$A$41, C$2:C$41, ">-1E+300")) / 2
=(MAXIFS($A$2:$A$41, B$2:B$41, ">-1E+300") + MIN(MINIFS($A$2:$A$41, C$2:C$41, ">-1E+300"), MINIFS($A$2:$A$41, D$2:D$41, ">-1E+300"))) / 2
This finds the last session with a number in the Baseline 1 column and the first session with a number in the Intervention 1 column, then averages them.This finds the last session that has a Baseline number and the first session that has a number for either treatment, then averages them. The test ">-1E+300" means “greater than a huge negative number,” so every number passes it, including 0. Empty cells, text, and the #N/A cells left by the Lesson 1 formula method don't pass, so they are skipped. (The shorter test "<>", “not empty,” counts #N/A cells as filled and puts the line in the wrong place.) For each later line, move both column letters one to the right (C and D, then D and E, and so on). The templates place every line with this kind of formula. Until each treatment has at least one value, the MINIFS for the empty column returns 0, so the line lands too far to the left. It moves into place once both treatments have been run. The alternating treatments template uses a formula that skips an empty treatment column, so its line is in place from the first treatment session, whichever treatment runs first. MAXIFS and MINIFS need Excel 2019 or later on Windows or Mac.
Changed the vertical axis bounds? Change the values in column H to match, and, if you changed the Maximum, the Label Y values in column L (Part B). Otherwise the phase-change lines stop short of the axes or stretch the axis range. If you changed the Minimum, also type the new minimum in the vertical axis’s Horizontal axis crosses › Axis value box (Lesson 3). Excel doesn’t update it for you, so without this the horizontal axis floats above the bottom tick. Lesson 5 changes the bounds when you stack the tiers, and walks you through both updates then.
Solid or dashed? Both appear in published single-case graphs. A common convention, taught in widely used behavior analysis textbooks, is to use solid lines for changes between conditions and dashed lines for smaller changes within a condition. Examples are a new criterion in a changing criterion design, or a parameter change within the same intervention. These lessons use one rule everywhere: every phase change, including each new criterion in a changing criterion design, gets a solid vertical line, and only the horizontal criterion lines are dashed. If your instructor or target journal follows the textbook convention, dash the vertical lines between criterion subphases instead. Whatever you choose, use it the same way in every figure. To make a line dashed, select it and choose a Dash type under Format Data Series › Fill & Line › Line.
Part B: Phase labels
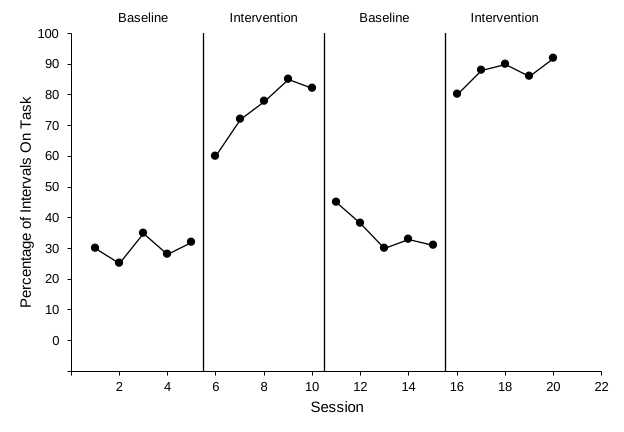
The labels work the same way: one invisible point per phase, centered over the phase at the top of the axis. Each point shows a data label whose text comes from a cell. Each label sits above its point, which puts it above the plot area once you make room there (step 7Lesson 5). Your second label, Alternating Treatments, names the whole alternating phase. A legend (steps 8 to 10) then tells the two treatments apart. In a changing criterion graph, each subphase's label is its criterion, such as 12 min.
| J | K | L | ||
|---|---|---|---|---|
| 1 | Label | Label X | Label Y | |
| 2 | Baseline | 3 | 100 | ← middle of sessions 1–5 |
| 3 | Intervention | 8 | 100 | ← middle of 6–10 |
| 4 | Baseline | 13 | 100 | ← middle of 11–15 |
| 5 | Intervention | 18 | 100 | ← middle of 16–20 |
- Type the label table. Type the header row and the four label rows above in J1:L5. Write the label text exactly as it should appear on the graph.
- Add the labels as a series. Open Chart Design›Select Data again and add a series named Phase labels, with X values K2:K5 and Y values L2:L5. Close the dialog. A colored marker appears at the top of each phase. Leave the markers visible for now, because they are easy to click.
- Turn on data labels. WindowsRight-click one of the new markers and choose Add Data Labels›Add Data Labels. MacControl-click one of the new markers and choose Add Data Labels. Numbers (100) appear next to each marker.
- Take the label text from the cells. Right-click one of the new labels and choose Format Data Labels.Control-click one of the new labels and choose Format Data Labels. Under Label Options › Label Contains, check Value From Cells, select J2:J5, and click OK. Then uncheck Y Value and Show Leader Lines. Under Label Position, choose Above. Finally, in the same pane, click Size & Properties (the box icon) › Alignment and uncheck Wrap text in shape, so each label stays on one line. Otherwise Excel breaks Alternating Treatments onto two lines, and the second line hangs down into the plot.
- Hide the markers. Click one of the label markers (not the text) to select the series. In Format Data Series › Fill & Line, set Line to No line and Marker › Marker Options to None.
- Check the label font. Click a label and confirm it is Arial 10 pt, black. Set it if not.
- Make room above the plot. Excel’s automatic layout leaves almost no space above the plot area, so the labels sit on its top edge, partly inside it. Click an empty spot inside the plot area, away from the points and lines. The pane title reads Format Plot Area, and sizing handles appear around the plot area. If something else is selected, go to the Format tab and choose Plot Area in the Chart Elements box of the Current Selection group.If a data path or line is selected instead, click a different empty spot nearer the middle of the plot. Point to the handle in the middle of the top edge. When the pointer becomes a two-headed arrow, drag down about 0.2 in (0.5 cm). When you let go, the labels sit just above the plot area, with a small gap between them and its top edge. The axis, the data, and the phase-change lines shrink with the plot area; the lines still end at the axis maximum, now just under the labels. Don’t drag much farther than 0.2 in: the plot area must stay at least five-eighths as tall as it is wide. Your vertical axis numbers are one digit wide, so the plot area comes out a little too wide for that: also point to the handle in the middle of its right edge and drag it left about 0.1 in (3 mm).
- Wait until Lesson 5 to make room above the labels. For now the labels sit on the top edge of the plot area, partly inside it. Lesson 5 makes this chart less than half as tall and copies it, and room you made now would shrink with it to almost nothing. So you make room above the top tier’s labels at the end of Lesson 5 (Part D, step 1).
- Add a legend. WindowsClick the chart, click the Chart Elements button (+) beside its top-right corner, and check Legend. MacClick the chart and choose Chart Design›Add Chart Element›Legend›Right. In the alternating phase, the legend is what tells Treatment A and Treatment B apart.
- Keep only the treatments in it. The legend lists every series, including Baseline, Phase change, and Phase labels. Baseline is already named by its phase label, and the other two are helper series, not data. Click the legend once to select it, then click the Baseline entry once more so only that entry is selected, and press Delete. Do the same for Phase change and Phase labels. This removes only the legend entry; the series stays on the graph.
- Move it inside the plot, without a border. Double-click the legend to open Format Legend. Under Legend Options › Legend Position, uncheck Show the legend without overlapping the chart, so the plot area does not shrink to make room for it. Under Fill & Line, set Border to No line. Then drag the legend by its edge to an empty part of the plot, such as the upper right of the plot area. Confirm it is Arial 10 pt, black.
Don't see Value From Cells? It is in Excel 2013 and later on Windows and in current Excel for Mac. If your version doesn't show it, label the phases with text boxes instead (see below). You can also click each label twice, slowly, so only that one label is selected, then type its text.
Building a multiple baseline graph? This finishes Participant 1's tier. In Lesson 5 you copy it for the other participants, give each copy its own phase-change line, and keep the phase labels on the top tier only.
Check before moving on
- Select Data lists your four data series, three Phase change series (one per line)one Phase change series, five Criterion series, and one Phase labels series
- Each phase-change line sitsThe phase-change line sits halfway between two sessions, at 5.5, 10.5, and 15.5, and runs from the horizontal axis to the top of the plot: solid black, 1 pt, no markers
- Each dashed criterion line sits at its criterion (12, 20, 16, 26, and 30) and spans only its own subphase, with no markers
- The vertical axis still runs from −10 to 100; the helper values did not stretch it
- The phase labels, Baseline, Intervention, Baseline, and Intervention, come from the cells in column J, sit above the plot area, centered over their phases,are centered over their phases (on the top edge of the plot until Lesson 5), and show no markers
- The top of the plot area sits just below the labels, and the phase-change lines end there
- Label text is Arial 10 pt, black, and each label is on one line
- Both helper tables sit to the right of column G, so Participants 2 and 3's data in columns D to G are untouched
- A borderless legend inside the plot lists only Treatment A and Treatment B and covers no data
- No phase-change lines and no phase labels
- A legend lists all five conditions, Play, Attention, Demand, Tangible, and Alone, each with its own marker
- The legend has no border and no fill, sits inside the plot, covers no data point or path, and is Arial 10 pt, black
The quick method: draw the lines and type the labelstype the labels
A multielement graph has no phase-change lines, but you can label each condition's path with a text box instead of using a legend.
For a rough draft, or if you only need one figure in a hurry:
- Select the chart first. Shapes and text boxes inserted while the chart is selected belong to the chart and move with it.
- Draw a phase-change line. WindowsGo to Insert›Illustrations›Shapes›Line. MacGo to Insert›Shapes›Line. Hold Shift and drag from the top of the plot to the horizontal axis, between the two sessions. Then set its outline to black, 1 pt.
- Add a label. Go to Insert›Text›Text Box,Go to Insert›Text Box, click just above the plot area, over the middle of the phase, and type the phase name. If there is no room above the plot area, drag its top edge down first, as in Part B, step 7.click just to the right of a condition's last point, and type the condition name. Set it to Arial 10 pt with no fill and no outline.
Drawn lines and text boxes don't move with the data. Check their positions again after any change to the axes or the chart size.