

Overview › Design guide › Changing criterion
Changing criterion design
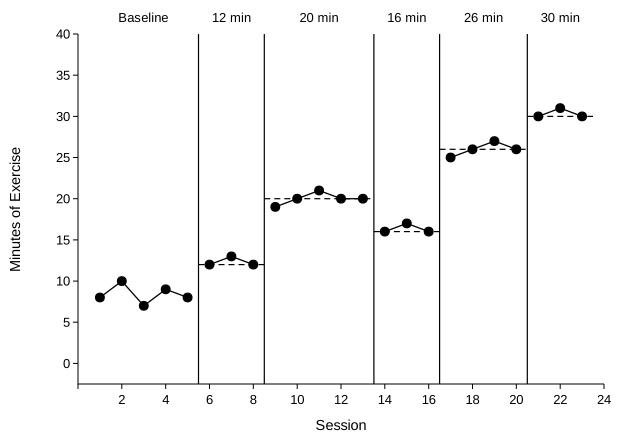
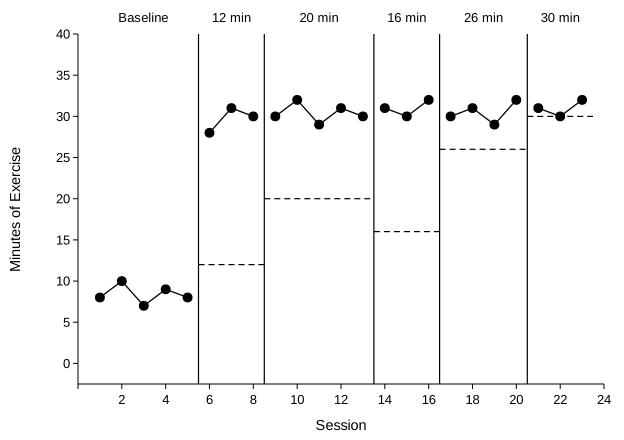
Change a performance criterion in steps. If behavior moves to each new criterion when it changes, and not before, the criterion is controlling it.
You will be able to
- Explain how each criterion change is a demonstration, and why subphase lengths and step sizes should vary.
- Tell behavior that tracks the criterion from a jump to the final level or a steady drift.
- Decide whether changing criterion graphs show experimental control, and say why when they don't, reaching 8 of your last 10 in the practice.
How it shows control
Each new criterion predicts a new level of behavior. When behavior shifts to match each criterion promptly, and stays near it until the next change, each step is a demonstration. Three things make the design stronger: subphases of different lengths, steps of different sizes, and a temporary step back down to a lower criterion. These show that the shifts follow the criterion, not the passage of time. The example below uses all three. With equal steps at equal intervals, a steady climb could look like control.
The logic of this design in more depth, its judgment calls and exceptions, and a knowledge check: Visual analysis Lesson 3, Part F.
Minimum standards
- At least three different criteria to meet the WWC pilot standards, giving three demonstrations.
- Each subphase needs at least three data points to count as an attempt to demonstrate an effect.
What experimental control looks like
What it doesn't look like
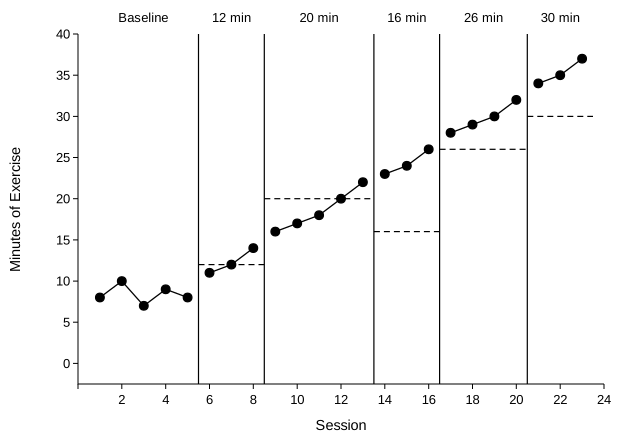
Practice
Decide whether each graph shows experimental control. When it doesn't, also choose why. An item counts only when both answers are right.
Graph it
- Template: changing-criterion.xlsx (all templates)
- Build it by hand: Excel Lessons 1–4 (Excel Lesson 6 recaps the settings)
- Build it with AI: the matching prompt