

Overview › Visual analysis › Lesson 2
Experimental control
Seeing a change is not the same as showing that the intervention caused it. Experimental control, also called a functional relation, requires the effect to appear repeatedly, exactly when the conditions change.
You will be able to
- Tell an effect from a functional relation, and say how many demonstrations a functional relation needs.
- Explain how prediction, verification, and replication show control, and where each design gets its demonstrations.
- Decide whether a graph from any design shows experimental control, reaching 8 of your last 10 in the practice.
An effect versus a functional relation
An effect is a change in behavior that lines up with a change in conditions. A functional relation is shown when that effect is demonstrated at least three times, at three different points in time (Horner et al., 2005). Three is a professional convention, and more demonstrations increase confidence (Kratochwill et al., 2010). Each demonstration reduces the chance that something other than the intervention is responsible.
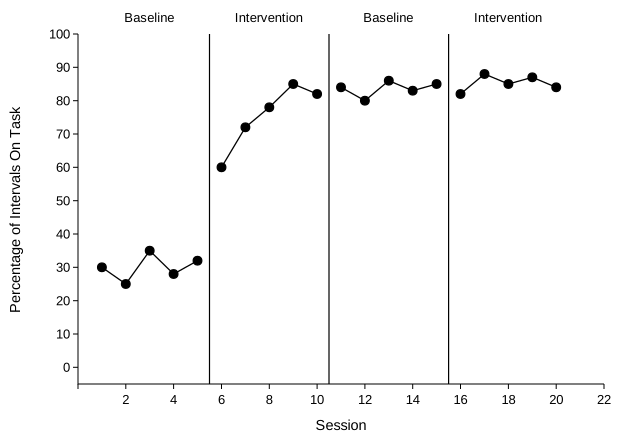
Non-effects weaken the case. A non-effect is a phase change where behavior should have changed and didn't, such as a tier that doesn't respond or a reversal that doesn't reverse. The WWC pilot standards rate three demonstrations with no non-effects as strong evidence. Three demonstrations plus a non-effect, such as a fourth tier that doesn't respond, is moderate evidence. A non-effect that leaves fewer than three demonstrations, such as one of three tiers not responding, means no functional relation is shown (Kratochwill et al., 2010).
Baseline logic
Single-case designs rely on baseline logic, which has three elements (Cooper et al., 2020):
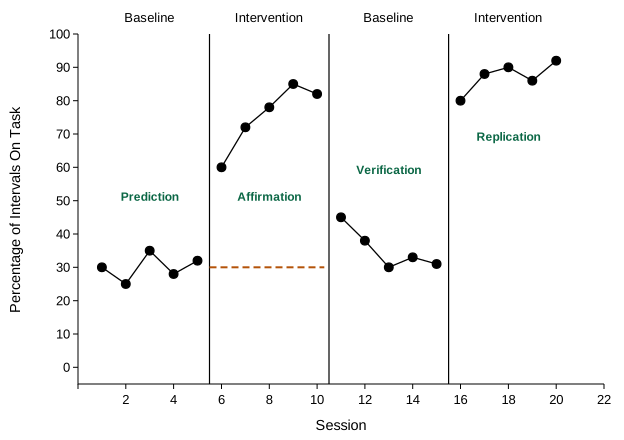
- Prediction. Stable baseline data predict what behavior would do without intervention.
- Verification. Evidence that the prediction was accurate, such as behavior returning toward baseline when the intervention is withdrawn in a reversal, or untreated tiers staying at their baseline level in a multiple baseline.
- Replication. The effect appears again when the conditions change again.
The step that links prediction to the intervention data is called affirmation of the consequent: if the intervention controls the behavior, behavior should change when the intervention starts, and it does. On its own this proves little, because something else could have changed at the same time. That is why verification and replication must follow. Some courses teach affirmation as a fourth step between prediction and verification. The logic is the same, and the figure below labels that step “Affirmation.”
Questions to ask of any graph
- Is baseline stable, or trending away from the expected change, long enough to predict from? (Usually at least 3 to 5 points.)
- Does behavior change when, and only when, the condition changes?
- Is the change large, immediate, and free of overlap?
- Are there at least three demonstrations at different times?
- Is there any non-effect, such as a tier that didn't respond or a reversal that didn't reverse? Does it leave fewer than three demonstrations?
- Could anything else explain the pattern: a baseline trend, covariation between tiers, or outside events?
Worked example: reading a reversal graph
This is the reversal graph from Excel Lessons 1 to 4, the one you build there with the graph type set to Reversal (ABAB): on-task behavior across baseline and a token economy. The model answer follows the order an assignment asks for: within phases, between phases, then a conclusion about control.
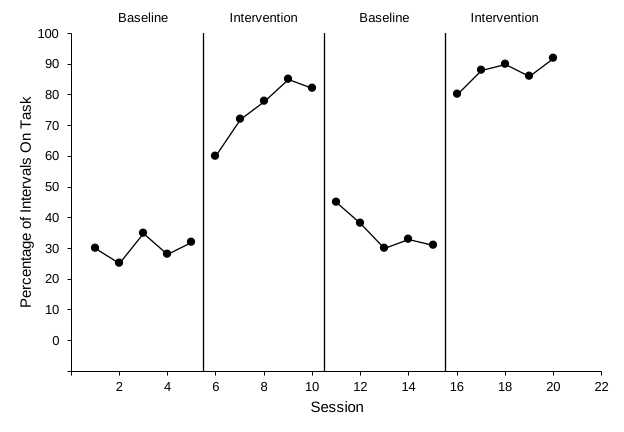
Within phases. Baseline 1 (sessions 1–5) is stable with no trend: mean 30%, range 25–35%. Intervention 1 (sessions 6–10) is higher (mean 75%, range 60–85%). It rises over the first four sessions and then levels off. Baseline 2 (sessions 11–15) falls to a mean of 35% (range 30–45%), starting at 45% and settling near 30–33%. Intervention 2 (sessions 16–20) is high and stable (mean 87%, range 80–92%).
Between phases. Each change is immediate. The mean of the last three points of one phase and the first three of the next goes from 32% to 70%, then from 82% to 38%, then from 31% to 86%. No point falls within the range of the adjacent phase, so there is no overlap. Similar phases are consistent: both baselines are low (30% and 35%), and both intervention phases are high (75% and 87%).
Conclusion. The effect appears three times, at three different points in time, with no non-effects. The graph demonstrates experimental control: a functional relation between the token economy and on-task behavior. Every phase has five data points, so the design meets the WWC pilot standards' minimum of five points per phase without reservations.
Compare a graph that falls short:
How each design gets its three demonstrations
| Design | Demonstrations come from | Common reason control fails |
|---|---|---|
| AB | Only one comparison | One demonstration at most, so never enough on its own |
| Reversal | Introduce, withdraw, reintroduce | Behavior doesn't reverse; baseline trend |
| Multiple baseline | Staggered starts across tiers | Untreated tiers change too; a tier doesn't respond |
| Alternating treatments | Repeated alternation | Paths overlap; carryover between conditions |
| Multielement (functional analysis) | Each test condition compared with Play in every cycle | Undifferentiated: no test condition consistently above Play |
| Changing criterion | Each criterion change | Behavior jumps or drifts instead of tracking steps |
A functional analysis asks its own question. It is a multielement design: test conditions such as Attention, Demand, Tangible, and Alone alternate with Play, the control condition. The analysis is differentiated when responding is consistently higher in at least one test condition than in Play. A differentiated analysis points to a function, or to more than one: escape, attention, or tangibles when that test condition stays above Play, or automatic reinforcement when only Alone is elevated. An undifferentiated analysis doesn't identify a social function, whether responding is high in every condition (which can point toward automatic reinforcement) or near zero in every condition (examples of each).
Visual analysts don't always agree. Agreement between experienced raters is far from perfect, especially for graphs with variability or trend. That is why structured aids and explicit criteria help (Lesson 4), and why clear graphing matters.
Practice
Graphs come from every design in the table above. If a design is new to you, read its page first (linked in the table): each one shows what control looks like in that design and the common ways it fails. Decide whether each graph shows experimental control, or, for a functional analysis, whether it is differentiated. Most graphs then ask a second question. When a graph doesn't show control, or a functional analysis isn't differentiated, choose why. When an alternating treatments graph shows control, choose which treatment produced less responding. When a functional analysis is differentiated, choose which test conditions are consistently above Play. An item with two questions counts only when both answers are right.