

Overview › Design guide › AB
AB design
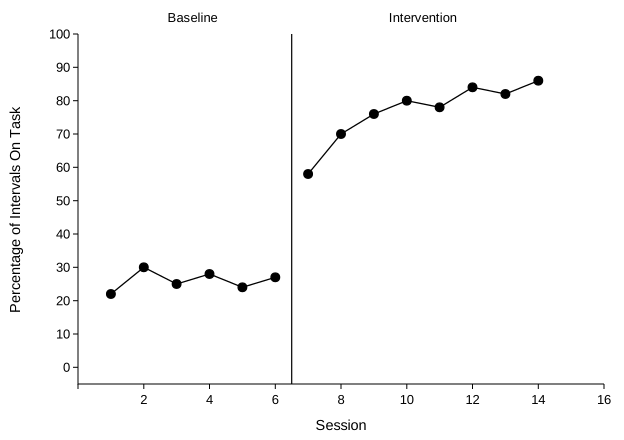
Baseline, then intervention. It's the simplest design and the starting point for every other one. But on its own, it can't show that the intervention caused the change.
You will be able to
- Explain why an AB graph can show a change but not experimental control.
- Name events, such as history and maturation, that an AB design can't rule out, and two ways to strengthen it.
- Decide whether AB and reversal graphs show experimental control, and say why when they don't, reaching 8 of your last 10 in the practice.
Why one change isn't enough
Baseline data predict what behavior would do with no intervention. When the data change after intervention starts, the prediction failed, which suggests an effect. But only once. Anything else that changed at the same time could explain it. Examples: a new medication, a new teacher, the school year ending (history), the child getting older (maturation), or repeated testing (practice effects). By the convention used in single-case standards, experimental control needs the effect to appear at least three times, at three different points in time (Horner et al., 2005). An AB design has one.
The logic of this design in more depth, its judgment calls and exceptions, and a knowledge check: Visual analysis Lesson 3, Part A.
Standards
The WWC pilot standards list AB designs (along with ABA and BAB) as designs that do not meet standards, because they can't provide three demonstrations of an effect.
How to strengthen an AB design
- Withdraw and reintroduce the intervention to make a reversal (ABAB) design.
- Replicate with staggered starts across three or more participants, behaviors, or settings: a multiple baseline design.
- In practice, AB graphs are still useful for decisions about one client. Describe them as showing change, not as proving the intervention caused it.
Practice
These graphs mix AB and reversal designs. Decide whether each one shows experimental control. When it doesn't, also choose why. An item counts only when both answers are right.
Graph it
- Template: ab-design.xlsx (all templates)
- Build it by hand: Excel Lessons 1–4
- Build it with AI: the matching prompt