

Overview › Build it in GraphPad Prism › Guide 5
Multiple baseline graphs
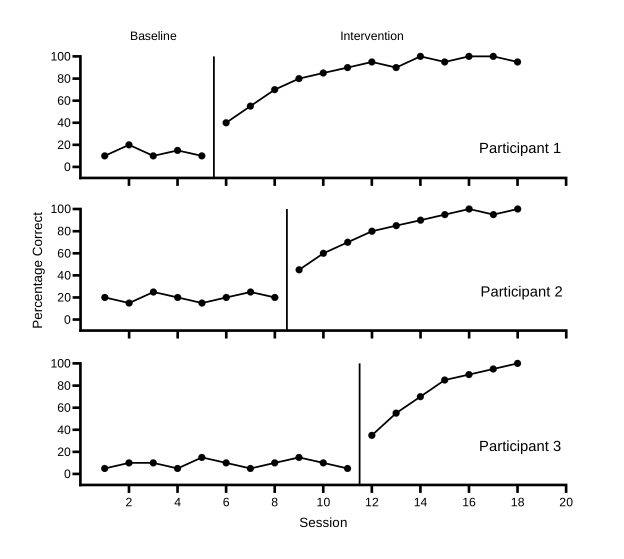
A multiple baseline figure is a stack of identical graphs, one per participant, behavior, or setting. They share one horizontal axis and are joined by a stepped phase-change line. You built the top tier in Guides 1 to 4. Here you make a data table and graph for each of the other participants, copy the top tier’s formatting to them with Prism’s Magic, and stack the three graphs in a layout.
You will be able to
- Make a short tier, then give each participant a data table and graph formatted like it, each with its own phase-change line.
- Stack and align the tiers in a Prism layout, with phase labels above the top tier only, one vertical axis title, and session numbers on the bottom tier only.
- Draw the stepped line that joins the phase changes across tiers.
Not needed for your graph. This guide is only for multiple baseline graphs, and your graph type is set to Reversal (ABAB). Your graph is complete after Guide 4, so go on to Guide 7: Export and place the figure.Go on to Guide 6: Alternating treatments, multielement, and changing criterion. To build a multiple baseline graph instead, switch to Multiple baseline.
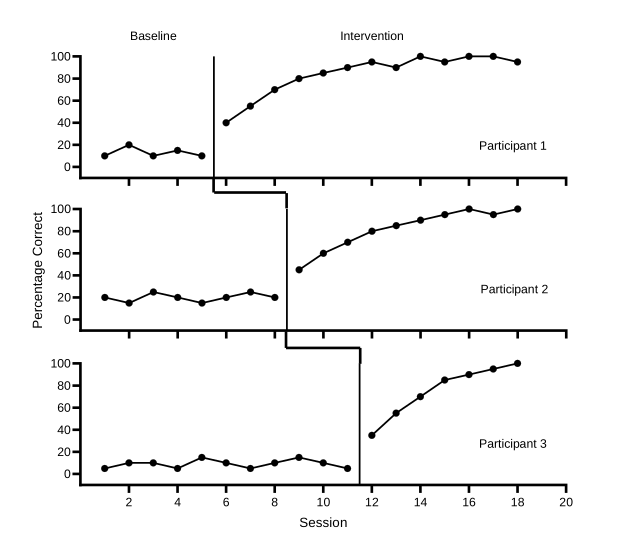
Practice data: practice-multiple-baseline-data.xlsx. It holds all three tiers. Guides 1 to 4 used Participant 1, in columns A:C. This guide adds the other two. To compare with the finished figure, download multiple-baseline.prism (Prism 10) or multiple-baseline.pzfx (older versions).
Part A: Make a data table and graph for each participant
Each tier gets its own XY data table, laid out exactly like Participant 1’s: Session as X, then a Baseline data set and an Intervention data set. Each table comes with its own graph.
| Tier | Data table / graph | Practice-file columns | Phase changes after | Phase-change line at X = |
|---|---|---|---|---|
| Tier 1 (top) | Participant 1 data / Participant 1 | A, B, C | Session 5 | 5.5 |
| Tier 2 (middle) | Participant 2 data / Participant 2 | A, D, E | Session 8 | 8.5 |
| Tier 3 (bottom) | Participant 3 data / Participant 3 | A, F, G | Session 11 | 11.5 |
- Check tier 1’s names. In the navigator, Participant 1’s data table should be named Participant 1 data and its graph Participant 1, as in Guide 2, step 4. If you haven’t built tier 1 yet, start at Guide 1 with Multiple baseline chosen.
- Add a data table. In the navigator, under Data Tables, click New Data Table. In the dialog that opens, make the same choices as in Guide 1: XY, X as Numbers, and Y as Enter and plot a single Y value for each point. Click Create.
- Paste Participant 2’s data. In the practice file, copy the session numbers in A2:A19 and paste them into row 1 of the X column. Then copy D2:E19 and paste it into row 1 of data set A. Finally, copy the headings in D1:E1 and paste them into data set A’s title cell, and type Session in the X column’s title cell.
- Make its graph and name both sheets. Click the new graph in the navigator. In Change Graph Type, choose XY and Points & connecting line, and click OK. Rename the table Participant 2 data and the graph Participant 2 (right-clickControl-click each in the navigator and choose Rename Sheet).
- Do the same for Participant 3. Add a third table the same way. Paste A2:A19 into the X column, F2:G19 into data set A, and F1:G1 into data set A’s title cell, and type Session as the X title. Make its graph and name the sheets Participant 3 data and Participant 3.
Part B: Make the top tier short
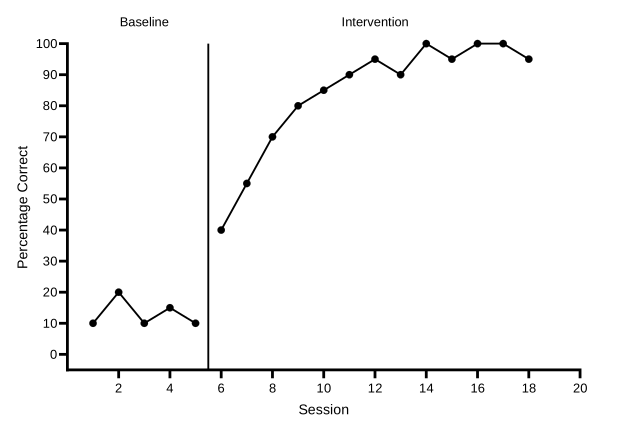
- Make the Y axis short. Open the Participant 1 graph and choose Change›Frame and Origin. Change Height (Length of Y axis) to 3.5 cm (1.38 in). Keep Width (Length of X axis) at 13.97 cm. Three tiers this short fit on one page with room for the figure number, title, and note.
- Rescale the vertical axis for a short tier. A 3.5-cm axis has no room for a number every 10. On the Left Y axis tab, set Minimum to -10, keep Maximum at 100, set Major ticks interval to 20, and keep Starting at Y= at 0. The minimum is still half an interval below 0, so zero still floats half a tick above the horizontal axis.
- Hide the session numbers and the axis titles on this tier. On the X axis tab, set Location of numbering/labeling to None; the tick marks stay. On the Titles & Fonts tab, untick Show X Axis Title and Show Left Y Axis Title. In the finished figure, only the bottom tier shows the session numbers and Session, and only the middle tier shows the vertical title.
- Move the phase labels down to the new top of the plot. On the X axis tab, click a … button in the Additional ticks and grid lines table. In Format Additional Ticks and Grids, select each label tick, Baseline at 3 and Intervention at 12.01, and change its Offset to 3.8 cm (1.5 in): the new Y axis length plus the same 0.3-cm gap. Leave the phase-change line at 5.5 as it is. Click OK twice.
- Add the tier name. Choose the Text tool on the toolbar, click inside the plot near its bottom-right corner, and type Participant 1. You set its size with the other tier names at the end, in Part E.
Part C: Copy the format to tiers 2 and 3
Prism’s Magic copies one graph’s formatting onto others, such as the symbols and lines, the axis ranges, and the fonts. Tier 1 is the example. Each tier keeps its own data, and you give each one its own phase-change line afterward.
- Start Magic from tier 2. Open the Participant 2 graph and choose Change›Magic. Make graphs consistent…. Choose the Participant 1 graph as the example to match, and click Next.
- Choose what to copy. Under Properties to apply, untick Additional ticks & grid lines with labels: tier 1’s phase-change line and phase labels belong to tier 1 only. Leave Free text unticked, so tier 1’s name isn’t copied. Leave the other ticked properties as they are and click OK. If the tier still shows a legend, turn it off as you did for tier 1 in Guide 3.
- Do the same for tier 3. Open the Participant 3 graph and repeat steps 1 and 2.
- Check the size of each tier. On each of the two new tiers, open Change›Frame and Origin and confirm that the axes are 13.97 cm by 3.5 cm (5.5 by 1.38 in), with the origin at the lower left and no frame. Type the lengths if Magic didn’t copy them. On the X axis and Left Y axis tabs, confirm the ranges match tier 1’s, including Starting at X= 2, so session 0 has no tick on any tier. Every tier needs the same axis lengths so the vertical scales match.
Now give each tier what is its own:
| Tier | Phase-change line | Session numbers and title | Vertical axis title | Phase labels | Tier name |
|---|---|---|---|---|---|
| Tier 1 | 5.5 (from Guide 4) | Hidden | Hidden | Baseline, Intervention | Participant 1 |
| Tier 2 | 8.5 | Hidden | Percentage Correct | None | Participant 2 |
| Tier 3 | 11.5 | Shown: numbers and Session | Hidden | None | Participant 3 |
- Give tier 2 its phase-change line. On the Participant 2 graph, open the X axis tab and add a row to Additional ticks and grid lines at 8.5, with Line ticked and Tick unticked. Format it as in Guide 4, Part A: solid black, 1 pt.
- Give tier 2 the vertical title. On the Titles & Fonts tab, tick Show Left Y Axis Title, and click OK. Double-click the title on the graph and type Percentage Correct. Tier 2 is the middle tier, so one title serves the whole figure and sits near its middle. Then add the tier name Participant 2 with the Text tool, as in Part B.
- Set up tier 3. On the Participant 3 graph, add its phase-change line at 11.5 the same way. On the X axis tab, set Location of numbering/labeling back to Auto (Below, horizontal), and on the Titles & Fonts tab, tick Show X Axis Title, which reads Session. Leave its vertical title hidden. Add the tier name Participant 3. No tier shows a graph title.
Part D: Stack the tiers in a layout
A Prism layout is a page that holds several graphs. It is linked to them, so a change to a tier’s graph or data shows up in the layout.
- Make a layout with one column of three graphs. Choose Insert›New Layout. In Create New Layout, under Standard arrangement, choose the picture of three graphs stacked in one column. Under Graphs or placeholders, choose Fill the layout with graphs, starting with and pick Participant 1. Click OK. The tiers fill the placeholders from the top: Participant 1, 2, then 3. If a placeholder stays empty, drag that tier’s graph onto it from the navigator. Rename the layout Multiple baseline figure.
- Show every tier at its real size. Choose Arrange›Equalize Scaling Factors and set them to 100%. A layout can shrink a graph to fit its placeholder; at 100% every tier keeps the size and font sizes you set.
- Line up the vertical axes. Click tier 1, then hold Shift and click tiers 2 and 3, so all three are selected. Choose Arrange›Align Y Axes. The three Y axes now form one straight column, even though only tier 2 has a vertical title.
- Stack the tiers closely. Select tier 2 alone and choose Arrange›Position Object. Move it up so that there is a small gap, about 0.9 cm, between tier 1’s X axis and the top of tier 2’s plot. Then move tier 3 up under tier 2 the same way. Keep each tier’s left position as Align Y Axes set it.
Part E: Draw the stepped phase-change line
The short segments that join the tiers sit in the gaps between graphs, so they are drawn on the layout.
- Choose the plain line tool. Open the drawing tools on the toolbar and choose the plain, straight line. Don’t use Prism’s zig-zag or step-shaped line tools: they draw horizontal, then vertical, then horizontal, which is the wrong shape for this step.
- Zoom in. Work zoomed in on the gap between tiers 1 and 2, so you can see where each segment ends.
- Draw three segments for each step.
Drag to draw each one:
- down from the bottom of tier 1’s phase-change line to halfway into the gap
- across to directly above tier 2’s phase-change line
- down to the top of tier 2’s phase-change line
- Format the segments. Double-click a segment, or select it and choose Change›Selected Object(s). Set the thickness to 1.5 pt, the color to black, and a solid style, the same as the axes. Do the same for the other five. Then drag any segment end that doesn’t quite meet a phase-change line until it does.
- Size the tier names. Click Participant 1, then hold Shift and click the other two names, and choose 10 in the font size list on the Text toolbar (Arial, not bold). Drag any name that moved back to the bottom right of its plot.
Shortcut: the finished project, multiple-baseline.prism, already has the three formatted tiers and the layout. Paste your data over the practice data in each table, move each tier’s phase-change line to your own phase change, and redraw the connector segments if the timing differs.
Across participants, behaviors, or settings? The figure is built the same way. Only the tier names change (for example, Home, School, Clinic). More than three tiers? Add one more data table and graph, apply Magic from tier 1, give the new tier its own phase-change line, add a row to the layout, and move the vertical title to the tier nearest the middle.
Check before moving on
- Three data tables, one per participant, each with Session as X and a Baseline and an Intervention data set
- Every tier has the same axes: X axis 13.97 cm long from 0 to 20, numbered from 2 (on the bottom tier), Y axis 3.5 cm long from −10 to 100 in steps of 20, starting at 0, so zero floats half a tick above the X axis
- Each tier’s phase-change line falls between its last baseline and first intervention session (5.5, 8.5, and 11.5) and runs the full height of its plot
- Phase labels appear above the top tier only, with an offset of 3.8 cm, and each tier has its name inside the plot
- One vertical axis title, on the middle tier; session numbers and the Session title on the bottom tier only; no graph titles
- In the layout, the scaling factors are 100% and the Y axes line up in one column
- The six connector segments are black, 1 pt, and solid, and meet each tier’s phase-change line with no gaps