

Overview › Build it in GraphPad Prism › Guide 2
Make the graph
Prism made a graph for your data table when it made the table. Open it, choose the Points & connecting line graph, check that Prism read your data sets correctly, and give the sheets names you will recognize later.
You will be able to
- Make a Prism XY graph with points and connecting lines from the data table, and fix one that doesn’t match.
- Explain why a single-case graph in Prism is an XY graph with one data set per phasecondition.
- Rename the data table and graph in Prism’s navigator so you can find them later.
Why an XY graph? An XY graph places every point at its real session number on a number line. That lets you put a phase-change line exactly at session 5.5, halfway between two sessions, and it lets you set the axis range precisely.That keeps each condition’s points at the sessions when they actually ran, and it lets you set the axis range precisely. A graph that treats sessions as categories would space them evenly whether or not sessions are missing. The Points & connecting line graph gives the familiar single-case look.
Steps
- Open the graph sheet. Prism lists every sheet in the project in the navigator on the left. Under Graphs, click Data 1. Prism made this graph sheet at the same time as the data table, and it is linked to the table.
- Choose Points & connecting line. The first time you open the graph, the Change Graph Type dialog asks what kind of graph to make. Under Graph family, choose XY. Then click Points & connecting line, the second picture in the XY row, and click OK. If the dialog didn’t appear, or you chose another kind of graph, choose Change›Graph Type to open it again.
- Compare your graph with this picture. You should see four paths with a gap at each phase change, each with its own symbol shape. You should see three paths, each with its own symbol shape. The Baseline path ends after session 4. Treatment A and Treatment B are each one continuous path, even though their data sets have blank cells between their values: by default, Prism joins a data set’s points across blank rows. You should see five paths, each with its own symbol shape. Each condition is one continuous path, even though its data set has blank cells between its values: by default, Prism joins a data set’s points across blank rows. There will also be a graph title (Data 1, the sheet’s name), a legend at the right that lists your data set titles, and bold 12-point text. Guide 3 changes all of that.
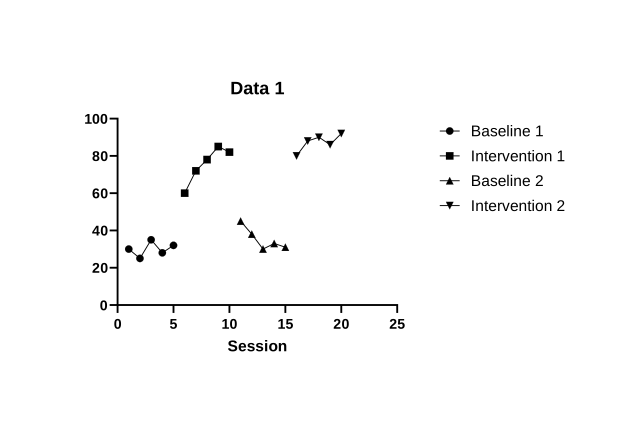
Doesn’t match?
- One path runs through every phasecondition: the values are all in one data set. Go back to Guide 1 and give each phasecondition its own data set.
- The points don’t sit at their session numbers: check the data table. The session numbers belong in the X column, and the first phasecondition in data set A. If they shifted one column, select the cells, delete them, and paste again into row 1 of the X column.
- Each point has an error bar, or each data set has several subcolumns: the table was made with a different Y option. Make a new XY table with the options in Guide 1, step 2, and paste the data again.
- You see bars, or points with no lines: choose Change›Graph Type, then XY and Points & connecting line.
- Name the data table and the graph. A Prism project keeps each sheet separately in the navigator: data tables under Data Tables, graphs under Graphs, and, from Guide 5, layouts under Layouts. Give the two sheets names you will recognize. WindowsRight-click the data table in the navigator and choose Rename Sheet.MacControl-click (or right-click) the data table in the navigator and choose Rename Sheet. Type the new name and press EnterReturn. Rename the graph the same way. The finished example project uses AB data and AB graph.The finished example project uses Reversal data and Reversal graph.Use Participant 1 data and Participant 1, as the finished example project does. Guide 5 adds a data table and graph for each of the other participants.The finished example project uses Alternating treatments data and Alternating treatments graph.The finished example project uses Multielement data and Multielement graph.The finished example project uses Changing criterion data and Changing criterion graph. The graph stays linked to its data table under any name, so a change to the data shows up on the graph.
- Save the project. WindowsPress Ctrl+S.MacPress ⌘+S.
Where is the size? In Excel you set the chart’s printed size in Lesson 2. In Prism the size of a graph is the length of its axes, which you set in the Format Axes dialog in Guide 3, before you choose any fonts. Fonts are fixed in points, so set the size first: the text then prints at the size you choose. APA asks for figure text between 8 and 14 points at final size.
The most common mistake
The most common mistake happens in the data table, not in the graph: all the values typed into one data set. Prism then draws one path that climbs straight from the last baseline point into intervention, so the phase change disappears into one continuous line. When conditions alternate, the result is worse: one zigzag line runs through every condition in session order, so no one can tell which point belongs to which condition. Your graph should show four separate paths, one per phasepaths, one per condition, each with its own symbol. If it doesn’t, fix the data table and Prism redraws the graph.