

Overview › Build it in GraphPad Prism › Guide 4
Phase-change lines and labels
Add the vertical lines that separate phases and the labels that name them. In Prism both are additional ticks on the X axis: each one sits at a session number, so it stays exactly in place when you resize, copy, or export the graph. Your alternating treatments graph also gets a tidy legend that names the two treatments. Your changing criterion graph also gets a dashed line at each criterion level, drawn from one more data set.A multielement graph has no phases, so it needs no phase-change lines and no phase labels. Instead, you tidy the legend inside the plot that names each condition.
You will be able to
- Place each phase-change line halfway between two sessions as an additional X-axis tick with a full-height grid line.
- Label each phase above the plot with an additional tick that shows only text, and explain why a label at a numbered session is typed 0.01 aside.
- Make the legend inside the plot name only the two treatments, in 10-point text.
- Draw a dashed criterion line for each subphase from a Criterion data set that breaks between subphases.
- Explain why a multielement graph has no phase-change lines or phase labels.
- Make the legend inside the plot name each condition in 10-point text and cover no data.
Why ticks, not drawn lines? A line or text box drawn with Prism’s drawing tools floats on top of the graph. Change the axis range or the graph’s size and it drifts away from the gap between sessions. An additional tick is positioned by a number on the X axis (session 5.5), so it can’t drift. The same idea works for the phase labels.
A legend instead of phase lines and labels
A multielement graph has no phases. The conditions alternate from the first session to the last, so there is no point where one phase ends and the next begins, and no phase for a label to name. Skip the phase-change lines and phase labels. The legend you kept in Guide 3 names each condition and shows its symbol. When you set the axis lengths, Prism moved it inside the plot, at the top right; if it isn’t there, drag it there. Each entry in it is its own object, in 12-point text.
- Make the legend text 10 pt. Click one legend entry, then choose 10 in the font size list on Prism’s Text toolbar. Do the same for each of the other entries. Keep the font Arial and not bold.
- Line the entries up. Click the first entry, then hold Shift and click each of the others, so all five are selected. Choose Arrange›Align Objects›Left. Its right edge should end before the end of the X axis, inside the plot. If it sticks out, keep the entries selected and press the left arrow key until it fits.
- Check that it covers no data. The legend must sit in an empty part of the plot, where it covers no data point or path. For the practice data, the upper right is clear: from session 22 on, every rate is below 1 response per minute. If yours covers data, drag the selected entries together to a clear spot.
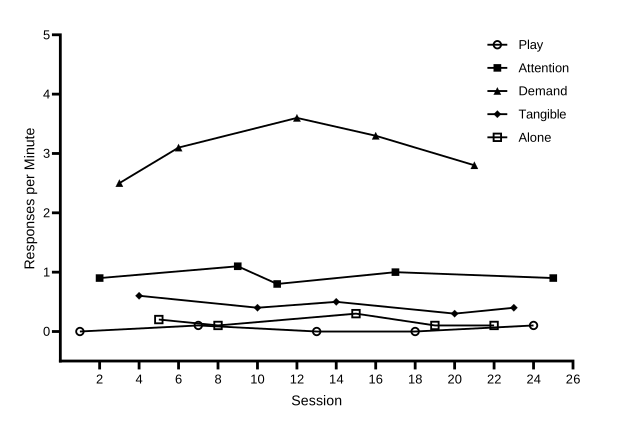
Why a legend? In a multielement graph every condition’s path runs across the whole graph, so there is no phase to write a name over. The legend is what lets a reader match each path to its condition. That works only if every condition’s symbol can be told apart in black and white, by its shape or by being filled or open. In the practice graph, Attention and Alone are both squares, so one is filled and the other open.
Part A: Phase-change lines
Each phase-change line is an additional tick on the X axis, halfway between the last session of one phase and the first session of the next, with its grid line turned on. A grid line runs the full height of the plot, from the X axis to the top. In practice-reversal-data.xlsx (Participant 1), the phase changes after sessionsessions 5, 10, and 15, so the lines goline goes at X = 5.5, 10.5, and 15.5.
- Open the X axis tab. Double-click the horizontal axis, or choose Change›X Axis. Format Axes opens on the X axis tab.
- Type the line positionsposition. Near the bottom of the tab is the Additional ticks and grid lines table, with the columns At X=, Tick, Line, and Text, and a … (details) button on each row. In the first row, type 5.5 under At X=, tick Line, and untick Tick. Fill in one row the same way for each of the other lines, as shown below.
| At X= | Tick | Line | Text |
|---|---|---|---|
| 5.5 | ☐ | ☑ |
| At X= | Tick | Line | Text |
|---|---|---|---|
| 5.5 | ☐ | ☑ | |
| 10.5 | ☐ | ☑ | |
| 15.5 | ☐ | ☑ |
| At X= | Tick | Line | Text |
|---|---|---|---|
| 5.5 | ☐ | ☑ |
| At X= | Tick | Line | Text |
|---|---|---|---|
| 4.5 | ☐ | ☑ |
| At X= | Tick | Line | Text |
|---|---|---|---|
| 5.5 | ☐ | ☑ | |
| 8.5 | ☐ | ☑ | |
| 13.5 | ☐ | ☑ | |
| 16.5 | ☐ | ☑ | |
| 20.5 | ☐ | ☑ |
- Format the linesthe line. Click the … button on a line’sthe line’s row. The Format Additional Ticks and Grids dialog opens, with every additional tick in a list on the left. Click Select all to change every line at once. Under Show Grid Line, set Thickness to 1 pt, Color to black, and Style to solid. Leave Show Tick and Show Text off.
- Close both dialogs. Click OK, then OK again. Each line runsThe line runs from the X axis to the top of the plot, exactly halfway between two sessions.
Dashed criterion lines
A changing criterion graph also shows the criterion in effect during each subphase as a dashed horizontal line. In Prism the criterion lines are one more data set, titled Criterion, typed in the data table below the practice data. Each line is two rows at its criterion level: one at the phase-change line where its subphase starts, and one at the line where it ends. The last line ends half a session after the last session. Between two lines comes a row with an X value and no Criterion value, which breaks the path, so each line spans only its own subphase.
| X | G | |
|---|---|---|
| Title | Session | Criterion |
| 24 | 5.5 | 12 |
| 25 | 8.5 | 12 |
| 26 | 8.5 | |
| 27 | 8.5 | 20 |
| 28 | 13.5 | 20 |
| 29 | 13.5 | |
| 30 | 13.5 | 16 |
| 31 | 16.5 | 16 |
| 32 | 16.5 | |
| 33 | 16.5 | 26 |
| 34 | 20.5 | 26 |
| 35 | 20.5 | |
| 36 | 20.5 | 30 |
| 37 | 23.5 | 30 |
- Title the new data set. Go back to the data table: click it under Data Tables in the navigator. In the title cell of the next empty data set, G, just after Phase 5, type Criterion.
- Type the criterion rows. Starting at row 24, just below the last session, type the X values in the X column and the criterion levels in the Criterion column, as shown above. Leave the Criterion cell empty in rows 26, 29, 32, and 35. Prism adds the new data set to the graph. If it doesn’t, go to the graph and choose Change›Add Data Sets.
- Make the criterion lines dashed. On the graph, open Change›Symbols & Lines and choose Criterion in the Data set list. Untick Show symbols. Under Show connecting line/curve, set the color to black, Thickness to 1 pt, and Pattern to dashed, the second pattern in the list. Untick Show legend.
- Break the path between criterion lines. Click the Graph Settings tab and choose Leave a gap under For point-to-point connecting lines, at each missing or off-scale Y value. Click OK. Each dashed line now spans only its own subphase. The phase data sets don’t change, because none of them has an empty row between its first and last values.
Solid or dashed? Both appear in published single-case graphs. A common convention, taught in widely used behavior analysis textbooks, is to use solid lines for changes between conditions and dashed lines for smaller changes within a condition. Examples are a new criterion in a changing criterion design, or a parameter change within the same intervention. These guides use one rule everywhere: every phase change, including each new criterion in a changing criterion design, gets a solid vertical line, and only the horizontal criterion lines are dashed. If your instructor or target journal follows the textbook convention, choose a dashed Style for those vertical lines in Format Additional Ticks and Grids. Whatever you choose, use it the same way in every figure.
Part B: Phase labels
Each phase label is another additional tick, at the middle of its phase, that shows only text: no tick mark and no grid line. Prism places the text above the plot, at a distance from the X axis that you type in. Your second label, Alternating Treatments, names the whole alternating phase. The legend then tells the two treatments apart. In a changing criterion graph, each subphase’s label is its criterion, such as 12 min.
| Text line 1 | At X= | |
|---|---|---|
| Baseline | 3 | ← the middle of sessions 1–5 |
| Intervention | 10.5 | ← the middle of sessions 6–15 |
| Text line 1 | At X= | |
|---|---|---|
| Baseline | 3 | ← the middle of sessions 1–5 |
| Intervention | 8.01 | ← the middle of sessions 6–10 is 8, which has a number under the axis, so type 8.01 |
| Baseline | 13 | ← the middle of sessions 11–15 |
| Intervention | 18.01 | ← the middle of sessions 16–20 is 18, which has a number under the axis, so type 18.01 |
| Text line 1 | At X= | |
|---|---|---|
| Baseline | 3 | ← the middle of sessions 1–5 |
| Intervention | 12.01 | ← the middle of sessions 6–18 is 12, which has a number under the axis, so type 12.01 |
| Text line 1 | At X= | |
|---|---|---|
| Baseline | 2.5 | ← the middle of sessions 1–4 |
| Alternating Treatments | 10.5 | ← the middle of sessions 5–16 |
| Text line 1 | At X= | |
|---|---|---|
| Baseline | 3 | ← the middle of sessions 1–5 |
| 12 min | 7 | ← the middle of sessions 6–8 |
| 20 min | 11 | ← the middle of sessions 9–13 |
| 16 min | 15 | ← the middle of sessions 14–16 |
| 26 min | 18.5 | ← the middle of sessions 17–20 |
| 30 min | 22.01 | ← the middle of sessions 21–23 is 22, which has a number under the axis, so type 22.01 |
- Open Format Additional Ticks and Grids. Double-click the horizontal axis to open the X axis tab, and click a … button in the Additional ticks and grid lines table.
- Add the first label. Click New Tick and set At X= to the first value in the table above. Tick Show Text and type the label in Text line 1. Set Location to Above, horizontal and Offset to 9.2 cm (3.62 in, if your Prism measures in inches). Untick Show Tick and Show Grid Line.
- Add the other labellabels. Click New Tick again for the second labeleach of the other labels and set it up the same way, with its own At X= and text. The labels go at X = 3, 8.01, 13, and 18.01.
- Close both dialogs. Click OK, then OK again. The labels sit just above the plot, centered over each phase.The labels sit just above the plot, centered over each phase. Guide 5 moves them down when it makes this tier shorter. They should come out in Arial 10 pt, like the axis numbers.
- Make the legend text 10 pt. When you set the axis lengths in Guide 3, Prism moved the legend inside the plot, at the top right; if it isn’t there, drag it there. It lists only Treatment A and Treatment B, because you turned off Baseline’s entry. Each entry is its own object, in 12-point text. Click one entry, then choose 10 in the font size list on Prism’s Text toolbar. Do the same for the other entry.
- Line the entries up. Click the first entry, then hold Shift and click the other, so both are selected. Choose Arrange›Align Objects›Left. Its right edge should end before the end of the X axis, inside the plot. If it sticks out, keep the entries selected and press the left arrow key until it fits.
- Check that it covers no data. The legend must sit in an empty part of the plot. In the practice graph the upper right is clear, because Treatment B stays below 2.1 and the axis runs to 3. If yours covers data, drag the selected entries to a clear spot.
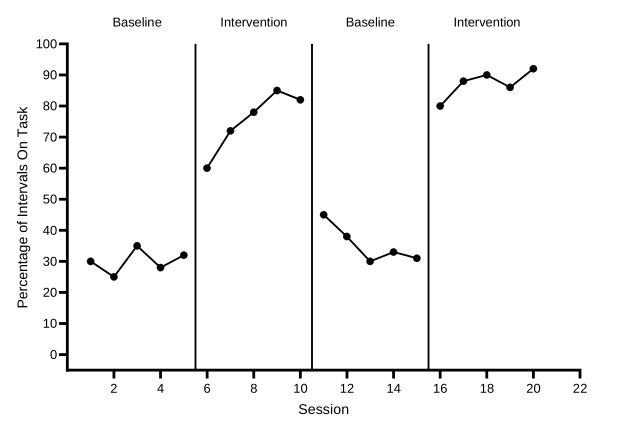
Why 9.2 cm, and why 0.01 aside? The offset is measured from the X axis, so a label sits just above the plot when its offset is the Y axis length (8.89 cm) plus a small gap of 0.3 cm. If you change the Y axis length, change every label’s offset to match.
A tick with text at a value that already has a number under the axis replaces that number. The middle of sessions 6–10 is 8, and a label typed at 8 would wipe out the 8 under the axis. So it is typed at 8.01, and the label for sessions 16–20 at 18.01.The middle of sessions 6–18 is 12, and a label typed at 12 would wipe out the 12 under the axis. So it is typed at 12.01.The middle of sessions 21–23 is 22, and a label typed at 22 would wipe out the 22 under the axis. So it is typed at 22.01.None of your labels falls on a numbered session, but in your own graphs a label at, say, 8 would wipe out the 8 under the axis; type 8.01 instead. A hundredth of a session is too small to see.
Building a multiple baseline graph? This finishes Participant 1’s tier. In Guide 5 you make it shorter, move its labels down to match, make a graph for each of the other participants, and stack the three in a layout.
Check before moving on
- The X axis tab lists an additional tick for each phase-change lineone additional tick for the phase-change line, at 5.5, 10.5, and 15.5, with Line ticked and Tick unticked
- Each phase-change line isThe phase-change line is solid black, 1 pt, and runs from the X axis to the top of the plot
- The Criterion data set fills rows 24 to 37, with no symbols, a dashed black 1-pt line, and no legend entry; Graph Settings is on Leave a gap
- Each dashed criterion line sits at its criterion (12, 20, 16, 26, and 30) and spans only its own subphase
- The phase labels, Baseline, Intervention, Baseline, and Intervention, sit above the plot, centered over their phases, each on one line, with no tick mark or grid line
- Each label tick has Location Above, horizontal and an offset of 9.2 cm
- Every number under the X axis still shows
- The legend inside the plot lists only Treatment A and Treatment B, in 10-pt Arial, lined up on the left, and covers no data
- No phase-change lines and no phase labels
- The legend lists all five conditions, Play, Attention, Demand, Tangible, and Alone, each with its own symbol
- The legend entries are 10-pt Arial, lined up on the left, inside the plot, and cover no data point or path