

Overview › Build it in GraphPad Prism › Guide 1
Set up an XY data table
The most important step in a single-case graph happens before you make the graph. In Prism, session numbers go in the X column and each phase gets its own Y data set. Prism then draws each phase as its own path, so the path breaks at every phase change.
The most important step in a single-case graph happens before you make the graph. In Prism, session numbers go in the X column and each condition gets its own Y data set. Prism then draws each condition as its own path, which is what lets a reader compare them.
You will be able to
- Create a Prism XY data table that has numbers for X and plots a single Y value for each point.
- Paste data so that Session is X and each phasecondition is its own data set, with the cells for other phasesconditions left empty, not 0.
- Explain why separate data sets break the data path at each phase changegive each condition its own data path.
What you will build in this series
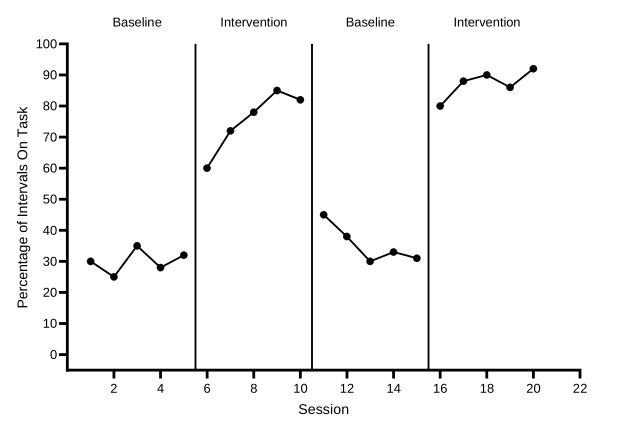
Across Guides 1 to 4 you will turn a small table of numbers into this reversal (ABAB) design graph: the first tier, Participant 1, of a three-tier figure. Guides 5 and 6 cover multiple baseline, alternating treatments, multielement, and changing criterion designs, so you can skip them for this graph. Guide 5 makes a graph for Participants 2 and 3 and stacks the three tiers into one figure. Along the way you will give each condition its own symbol, keep each treatment’s points connected across the sessions when the other treatment ran, and tidy a legend. Guide 6 recaps these settings for when you graph your own data. Along the way you will give each condition its own symbol, keep each condition’s points connected across the sessions when other conditions ran, and tidy a legend. A multielement graph has no phase-change lines. Guide 6 recaps these settings for when you graph your own data. Along the way you will add a dashed criterion line for each subphase and label each subphase with its criterion. Guide 6 recaps these settings for when you graph your own data.
Want to follow along with the same numbers? Download practice-reversal-data.xlsx. It has the data already typed and nothing else. It holds all three participants. Guides 1 to 4 use only Participant 1, in columns A:C. To check your work at any stage, the finished Prism project is reversal-abab.prism.
The layout: Session as X, one data set per phasecondition
A Prism XY data table has one X column and a row of Y columns, labeled A, B, C, and so on. Each Y column is a data set, and Prism draws each data set as its own path with its own symbol.
Put session numbers in the X column. Give each phase its own data set. Then type each session’s value only in the data set for the phase it belongs to, and leave the other cells in that row empty.
Put session numbers in the X column. Give each condition its own data set. Then type each session’s value only in the data set for the condition run in that session, and leave the other cells in that row empty.
| X | A | B | |
|---|---|---|---|
| Title | Session | Baseline | Intervention |
| 1 | 1 | 55 | |
| 2 | 2 | 62 | |
| 3 | 3 | 48 | |
| 4 | 4 | 66 | |
| 5 | 5 | 58 | |
| 6 | 6 | 40 | |
| 7 | 7 | 31 | |
| 8 | 8 | 26 | |
| 9 | 9 | 18 | |
| 10 | 10 | 12 | |
| 11 | 11 | 14 | |
| 12 | 12 | 6 | |
| 13 | 13 | 9 | |
| 14 | 14 | 4 | |
| 15 | 15 | 5 |
| X | A | B | C | D | |
|---|---|---|---|---|---|
| Title | Session | Baseline 1 | Intervention 1 | Baseline 2 | Intervention 2 |
| 1 | 1 | 30 | |||
| 2 | 2 | 25 | |||
| 3 | 3 | 35 | |||
| 4 | 4 | 28 | |||
| 5 | 5 | 32 | |||
| 6 | 6 | 60 | |||
| 7 | 7 | 72 | |||
| 8 | 8 | 78 | |||
| 9 | 9 | 85 | |||
| 10 | 10 | 82 | |||
| 11 | 11 | 45 | |||
| 12 | 12 | 38 | |||
| 13 | 13 | 30 | |||
| 14 | 14 | 33 | |||
| 15 | 15 | 31 | |||
| 16 | 16 | 80 | |||
| 17 | 17 | 88 | |||
| 18 | 18 | 90 | |||
| 19 | 19 | 86 | |||
| 20 | 20 | 92 |
| X | A | B | |
|---|---|---|---|
| Title | Session | P1 Baseline | P1 Intervention |
| 1 | 1 | 10 | |
| 2 | 2 | 20 | |
| 3 | 3 | 10 | |
| 4 | 4 | 15 | |
| 5 | 5 | 10 | |
| 6 | 6 | 40 | |
| 7 | 7 | 55 | |
| 8 | 8 | 70 | |
| 9 | 9 | 80 | |
| 10 | 10 | 85 | |
| 11 | 11 | 90 | |
| 12 | 12 | 95 | |
| 13 | 13 | 90 | |
| 14 | 14 | 100 | |
| 15 | 15 | 95 | |
| 16 | 16 | 100 | |
| 17 | 17 | 100 | |
| 18 | 18 | 95 |
| X | A | B | C | |
|---|---|---|---|---|
| Title | Session | Baseline | Treatment A | Treatment B |
| 1 | 1 | 2.1 | ||
| 2 | 2 | 2.5 | ||
| 3 | 3 | 1.9 | ||
| 4 | 4 | 2.3 | ||
| 5 | 5 | 1.2 | ||
| 6 | 6 | 1.9 | ||
| 7 | 7 | 2 | ||
| 8 | 8 | 0.8 | ||
| 9 | 9 | 0.6 | ||
| 10 | 10 | 1.7 | ||
| 11 | 11 | 1.8 | ||
| 12 | 12 | 0.4 | ||
| 13 | 13 | 1.6 | ||
| 14 | 14 | 0.3 | ||
| 15 | 15 | 0.2 | ||
| 16 | 16 | 1.9 |
| X | A | B | C | D | E | |
|---|---|---|---|---|---|---|
| Title | Session | Play | Attention | Demand | Tangible | Alone |
| 1 | 1 | 0 | ||||
| 2 | 2 | 0.9 | ||||
| 3 | 3 | 2.5 | ||||
| 4 | 4 | 0.6 | ||||
| 5 | 5 | 0.2 | ||||
| 6 | 6 | 3.1 | ||||
| 7 | 7 | 0.1 | ||||
| 8 | 8 | 0.1 | ||||
| 9 | 9 | 1.1 | ||||
| 10 | 10 | 0.4 | ||||
| 11 | 11 | 0.8 | ||||
| 12 | 12 | 3.6 | ||||
| 13 | 13 | 0 | ||||
| 14 | 14 | 0.5 | ||||
| 15 | 15 | 0.3 | ||||
| 16 | 16 | 3.3 | ||||
| 17 | 17 | 1 | ||||
| 18 | 18 | 0 | ||||
| 19 | 19 | 0.1 | ||||
| 20 | 20 | 0.3 | ||||
| 21 | 21 | 2.8 | ||||
| 22 | 22 | 0.1 | ||||
| 23 | 23 | 0.4 | ||||
| 24 | 24 | 0.1 | ||||
| 25 | 25 | 0.9 |
| X | A | B | C | D | E | F | |
|---|---|---|---|---|---|---|---|
| Title | Session | Baseline | Phase 1 | Phase 2 | Phase 3 | Phase 4 | Phase 5 |
| 1 | 1 | 8 | |||||
| 2 | 2 | 10 | |||||
| 3 | 3 | 7 | |||||
| 4 | 4 | 9 | |||||
| 5 | 5 | 8 | |||||
| 6 | 6 | 12 | |||||
| 7 | 7 | 13 | |||||
| 8 | 8 | 12 | |||||
| 9 | 9 | 19 | |||||
| 10 | 10 | 20 | |||||
| 11 | 11 | 21 | |||||
| 12 | 12 | 20 | |||||
| 13 | 13 | 20 | |||||
| 14 | 14 | 16 | |||||
| 15 | 15 | 17 | |||||
| 16 | 16 | 16 | |||||
| 17 | 17 | 25 | |||||
| 18 | 18 | 26 | |||||
| 19 | 19 | 27 | |||||
| 20 | 20 | 26 | |||||
| 21 | 21 | 30 | |||||
| 22 | 22 | 31 | |||||
| 23 | 23 | 30 |
Why separate data sets? Prism connects the points of one data set and never joins one data set to another. With four phase data sets you get four separate paths, which is exactly the break that single-case conventions require at each phase change. If all the values were in one data set, Prism would join the last baseline point to the first intervention point. That suggests continuity between conditions that didn’t happen.
In a multiple baseline design every tier follows the same rule, with its own Baseline and Intervention data sets. Guides 1 to 4 use only Participant 1. Guide 5 makes a data table like this one for Participants 2 and 3.
Why separate data sets? Prism draws each data set as its own path with its own symbol, so a reader can compare the conditions session by session. Because the treatmentsconditions take turns, each data set has blank cells between its values. By default, Prism joins a data set’s points across those blank rows, so each condition still reads as one continuous path. If all the values were in one data set, Prism would draw a single zigzag line through every condition, and no reader could tell them apart.
The Baseline data set has no values after session 4, so its path still ends at the phase change.
A multielement graph has no phase changes, so there are no breaks to make. The data sets only keep the conditions apart.
Steps
- Start an XY table. Open Prism. In the Welcome dialog, under CREATE, choose XY. (If Prism is already open, start a new project from the File menu to get the same dialog.)
- Choose the X and Y options. Under X, choose Numbers. Under Y, choose Enter and plot a single Y value for each point. Click Create. Prism opens an empty data table named Data 1, with an X column and Y columns A, B, C, and so on.
- Copy the data from the practice file. Open practice-reversal-data.xlsx in Excel or Google Sheets. Select A2:E21: every row of data, without the headings in row 1. That is Session and Participant 1’s two columns. Leave Participants 2 and 3 for Guide 5. WindowsPress Ctrl+C.MacPress ⌘+C.
- Paste into row 1 of the X column. In Prism, click the first cell of the X column, in row 1. That is the cell just below the column’s title cell, not the title cell itself. WindowsPress Ctrl+V.MacPress ⌘+V. Prism fills the X column with the session numbers, 1 to 20, and puts each phasecondition in the next data set. Blank cells in the spreadsheet stay blank in Prism.
- Paste the headings into the title row. Back in the practice file, select the headings in A1:E1 and copy them. In Prism, click the title cell at the top of the X column and paste. Prism fills the X title, Session, and the title of each data set: Baseline 1, Intervention 1, Baseline 2, and Intervention 2. These titles name the data sets in Prism’s dialogs, and the X title becomes the horizontal axis title. You add the phase labels shown on the graph separately in Guide 4. These titles name the data sets in Prism’s dialogs, and the X title becomes the horizontal axis title. The legend uses the data set titles exactly as typed, so Treatment A and Treatment B should be spelled the way you want them to appear on the graph. These titles name the data sets in Prism’s dialogs, and the X title becomes the horizontal axis title. The legend lists the data set titles exactly as typed, so spell each condition the way you want it to appear on the graph.
- Leave the other cells truly empty. Compare your table with the drawing above. Each row should have a value in exactly one data set. Don’t type 0, a space, or a dash in cells that belong to other phasesconditions: Prism would plot a typed 0. If you typed something by mistake, select the cell and press Delete. A real zero is different: if you measured the behavior in a session and it was zero, type 0 in that session’s own data set so the point is plotted. In the practice data, Play is 0 in sessions 1, 13, and 18.
- Save the project.
WindowsPress Ctrl+S.MacPress ⌘+S.
Prism 10 saves the whole project, data table and graph together, as one
.prismfile.
Values, not formulas
A Prism data table holds numbers, not spreadsheet formulas. When you paste cells from Excel or Google Sheets, Prism keeps the values they showed. If you later change the data in your spreadsheet, copy and paste them into Prism again.
Every cell in the table must hold a number or nothing. If your spreadsheet shows text in cells that should be blank, such as the #N/A that Excel’s NA() formula leaves, check those cells after you paste. Select any cell in Prism that shows text and press Delete, so it is truly empty.
Data in one long column? Data sheets often have three columns: Session, PhaseCondition, and Value. Prism needs one column per phasecondition, so restructure the data in your spreadsheet first, then paste the result. Excel Lesson 1: Set up your data shows a formula that does it without retyping, and it works the same way in Google Sheets.
Typing instead of pasting? Type each session number in the X column and each value in its own data set’s column, on the same row. Then type the titles in the title row: Session over X, and one title per data set.
Check before moving on
- The table is an XY table with numbers for X and a single Y value for each point
- The X column holds session numbers that run 1, 2, 3 … 20 without gaps, and its title is Session
- Each phasecondition has its own data set, titled Baseline 1, Intervention 1, Baseline 2, and Intervention 2
- Each row has a value in exactly one data set
- Cells for other phasesconditions are empty, not 0, and no cell shows text
- Each treatment’scondition’s data set has blank cells between its values. That is expected
- The table holds only Session and Participant 1’s two columns