

Overview › Build it with AI › Lesson 5
Prompt library
Copy-ready prompts for Claude or ChatGPT in Excel. Edit the bracketed, underlined parts to match your data. The brackets only mark what to edit; they are not copied with the prompt. Use de-identified data, and run the audit prompt after every graph. The multiple baseline prompts are in Lesson 4.
You will be able to
- Restructure long-format data into phase or condition columns with a prompt.
- Adapt a short prompt and the shared style block to build an AB, reversal, alternating treatments, multielement, or changing criterion graph.
- Have the assistant draft a figure title, note, and alt text, and check each one against your data.
Shared style block
Several prompts below say "Apply the APA style block." Paste this block at the end of those prompts, or send it once at the start of the conversation and refer back to it.
APA STYLE BLOCK
- Native Excel X Y (scatter) chart with straight lines and markers; column A (Session) is the X values for every series; one series per phase or condition column.
- Size 6.5 in wide x 4.5 in tall. No chart title, no legend unless the prompt asks for one, no gridlines, no chart-area border, no plot-area fill or border.
- Axes: solid black 0.75 pt lines, major tick marks outside, no minor tick marks. Horizontal axis min 0, max = the first multiple of the major unit after the last session, major unit 2 unless the prompt gives another, number format 0;; (hides the 0 label), title "Session".
- Floating zero: vertical axis minimum exactly one major unit below 0, negative labels hidden (number format 0;;0), whole-number labels only (for rates, a major unit of 1 or more), horizontal axis crossing at the vertical minimum.
- All text Arial, black, not bold: tick labels 10 pt, axis titles 11 pt, labels 10 pt.
- Data paths: black 1 pt lines; markers size 6 with black borders. Never use color.
- Phase-change lines: two-point series from a helper table (X halfway between phases by formula, Y from the vertical axis minimum to its maximum), black 1 pt, no markers. Never drawn shapes.
- Phase labels: a helper table with one row per phase giving the label text, X = the middle session of that phase, computed by formula as (first session + last session) / 2, and Y = the vertical axis maximum. Add it as one series with no line or markers; data labels from the label-text cells instead of the Y values, positioned above, Arial 10 pt black. Then lower the plot area's top edge by about 0.2 in (14 pt), keeping its bottom, left, and right edges where they are, so every label sits above the plot area, outside it.
- Never change my original data cells. Finish by listing every range you added and anything you could not apply exactly.
Restructure long data into phase or condition columns
Use this when your data sheet has one row per session with a phase or condition column. Name your design in the prompt, because the layout depends on it. As in Excel Lesson 1, phases that follow one another get one column each, and a phase that comes back gets its own numbered column. In alternating treatments and multielement designs, each condition keeps one column however many times it is run.
My data are in long format on this sheet: column A = session number, column B = phase or condition name, column C = value. The design is a reversal (ABAB) design.

Create a new sheet named "Graph data" laid out for a single-case graph:
- Column A: every session number once, in order, one per row, starting in row 2, with the header "Session" in A1.
- From column B, one column per phase or condition, laid out by design:
  - Sequential phases (AB, reversal, each tier of a multiple baseline, changing criterion): one column per phase, in the order the phases occur. When a phase comes back after a different phase, give each occurrence its own numbered column (Baseline 1, Baseline 2). In a changing criterion design, each criterion subphase is its own phase.
  - Alternating conditions (alternating treatments, multielement functional analysis): while the conditions alternate, exactly one column per condition, however many times it is run. Never number its repeats or split it across columns. A phase run on its own before or after the alternating phase (such as Baseline, or a final phase with only the best treatment) gets its own column, in order.
  - If my data also have a participant or tier column (multiple baseline), lay out each tier's phase columns in turn, with the tier at the start of each heading (P1 Baseline, P1 Intervention, P2 Baseline ...), all sharing the Session rows.
- Put each session's value only in the column for its phase or condition, on that session's row. Leave every other cell truly empty (not 0, not ""), including the cells for sessions when a condition was not run.
- Don't change the original sheet.
Then list each column you created with its first and last session and how many values it holds, and check that those counts add up to the number of data rows on my original sheet.
AB and reversal designs
Lesson 2 has a full prompt for each graph type. This shorter version relies on the style block.
Make an APA-style single-case graph from this sheet. Column A is Session; columns B to E are the phases Baseline 1, Intervention 1, Baseline 2, Intervention 2.
- Vertical axis: min -10, max 100, major unit 10, title "Percentage of Intervals On Task". Horizontal major unit 2.
- All phase series: filled black circle markers.
- Phase-change lines at every phase change.
- Phase labels: Baseline, Intervention, Baseline, Intervention.
Apply the APA style block.
Alternating treatments design
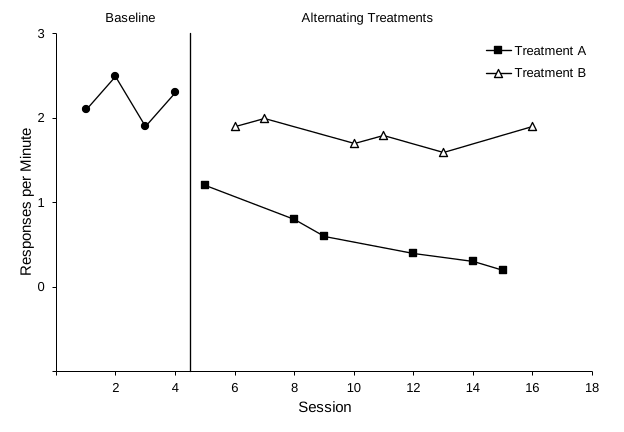
Make an APA-style alternating treatments graph from this sheet. Column A is Session; column B is Baseline; C is Treatment A; D is Treatment B. During the alternating phase, each session's value is only in the column for the condition run that session.
- Set the chart's hidden and empty cells option to "Connect data points with line", so each condition is one continuous path.
- Markers: Baseline filled black circles; Treatment A filled black squares; Treatment B open triangles (white fill, black border).
- Vertical axis: min -1, max 3, major unit 1, whole-number labels, title "Responses per Minute".
- One phase-change line between Baseline and the alternating phase; phase labels "Baseline" and "Alternating Treatments".
- A legend inside the top-right of the plot area, no border, listing only Treatment A and Treatment B.
Apply the APA style block.
Multielement functional analysis
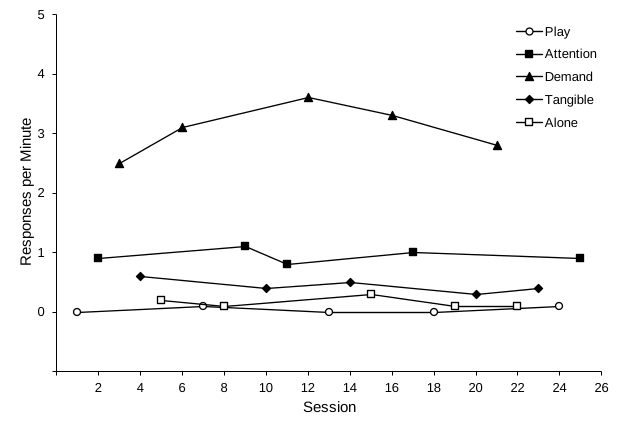
Make an APA-style multielement functional analysis graph from this sheet. Column A is Session; columns B to F are the conditions Play, Attention, Demand, Tangible, Alone. Each session's rate is only in the column of the condition run that session.
- Set hidden and empty cells to "Connect data points with line", so each condition is one continuous path.
- Distinct black-and-white markers: Play open circle; Attention filled square; Demand filled triangle; Tangible filled diamond; Alone open square.
- Vertical axis: min -1, max 5, major unit 1, whole-number labels, title "Responses per Minute". No phase-change lines or phase labels.
- A legend inside the top-right of the plot area, no border.
Apply the APA style block.
Changing criterion design
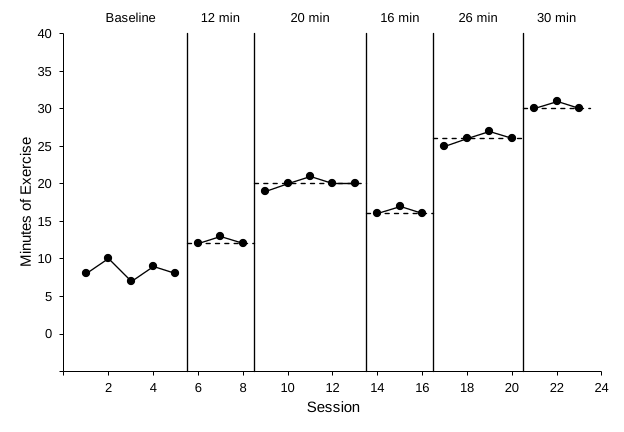
Make an APA-style changing criterion graph from this sheet. Column A is Session; columns B to G are Baseline, Phase 1, Phase 2, Phase 3, Phase 4, Phase 5. The criteria are Phase 1 = 12, Phase 2 = 20, Phase 3 = 16, Phase 4 = 26, Phase 5 = 30.
- Filled black circle markers for all phases.
- Phase-change lines between every pair of adjacent phases.
- For each criterion phase, a horizontal criterion line as a two-point series from a helper table: X from half a session before the phase's first session to half a session after its last (formulas), Y = the criterion. Black 1 pt dashed, no markers.
- Phase labels: Baseline, 12 min, 20 min, 16 min, 26 min, 30 min.
- Vertical axis: min -5, max 40, major unit 5, title "Minutes of Exercise".
Apply the APA style block.
Fix an existing chart
Already have a chart you made earlier? Select it, then send:
Reformat the selected chart into an APA-style single-case graph without changing what data it shows.
- If it is a line chart, convert it to X Y scatter with straight lines and markers using the session numbers as X values.
- If all phases are in one series, tell me. Don't restructure my data without asking.
- If the chart shows alternating treatments or a multielement functional analysis, set hidden and empty cells to "Connect data points with line", and show a legend inside the top-right of the plot area, with no border, that lists only the conditions that alternate. Otherwise, remove the legend.
- Then apply the APA style block, keeping the current axis titles.
Figure caption, note, and alt text
Look at the chart on this sheet and its data. Write:
1. An APA 7 figure title in title case (one line, no period) for "Figure 1".
2. A figure note beginning "Note." that defines the measure and each phase or condition abbreviation, in under 60 words. The measure is percentage of 10-s intervals with on-task behavior.
3. Alt text of one or two sentences describing the main finding (levels and changes across phases), not the formatting.
Base everything only on the data shown. Do not invent participant details, statistics, or interpretations.
Read what the assistant writes against your data and your method section. It can describe trends that aren't there, or use terms differently than your field does.