

Overview › Visual analysis › Lesson 1
The six features of visual analysis
Visual analysts look at six features of the data, first within each phase and then between phases. Together, they answer whether behavior changed and whether it changed when the conditions did.
You will be able to
- Describe the level, trend, and variability of the data within each phase.
- Judge immediacy, overlap, and consistency between phases, using the last three and first three points and the range of each phase.
- Answer feature questions about new graphs, reaching 8 of your last 10 in the practice.
Where the six features come from. They are the features named in the What Works Clearinghouse single-case standards (Kratochwill et al., 2010), drawing on decades of behavior-analytic practice. The colored lines and bands on these figures are teaching aids. They don't belong on a publication graph.
Within a phase
1. Level
The typical value of the data in a phase, usually its mean or median. Compare levels between adjacent phases to see how much behavior changed.
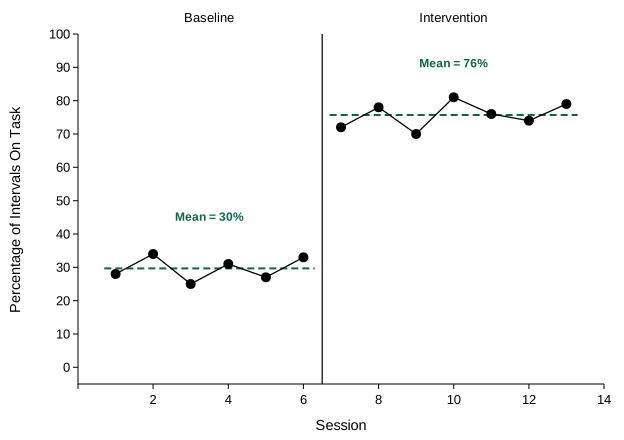
2. Trend
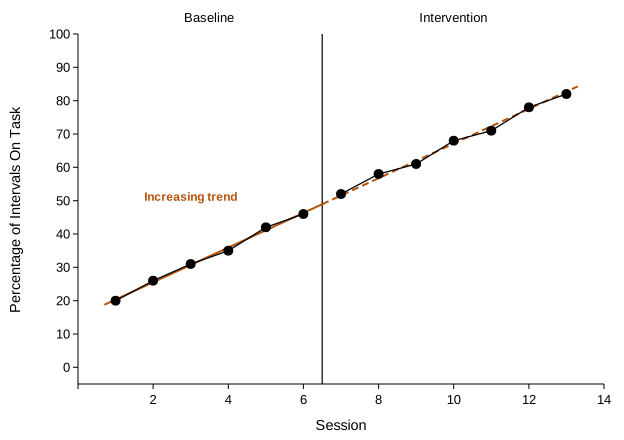
The direction and steepness of the data path, often summarized by a best-fitting straight line. A baseline already trending in the direction you hope the intervention will produce makes any later change hard to credit to the intervention. To check, extend the baseline trend line into the next phase and see whether the new data simply follow it.
3. Variability
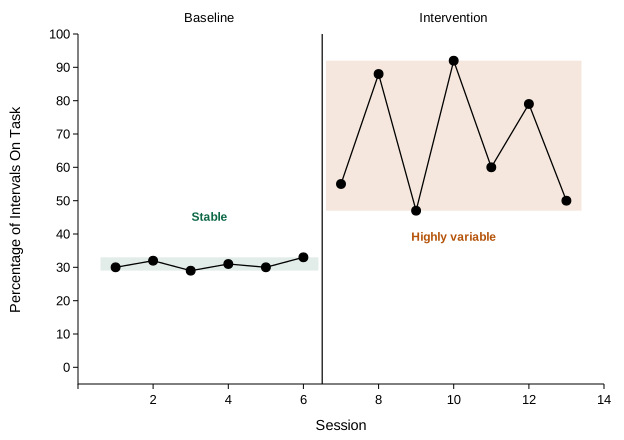
How much the data bounce around the phase's level, often described by the range. High variability makes the level hard to predict and needs more data before a phase change. Lesson 6 measures it from every point, with each point's distance from the level line, the variance, and the standard deviation.
Between phases
4. Immediacy of the effect
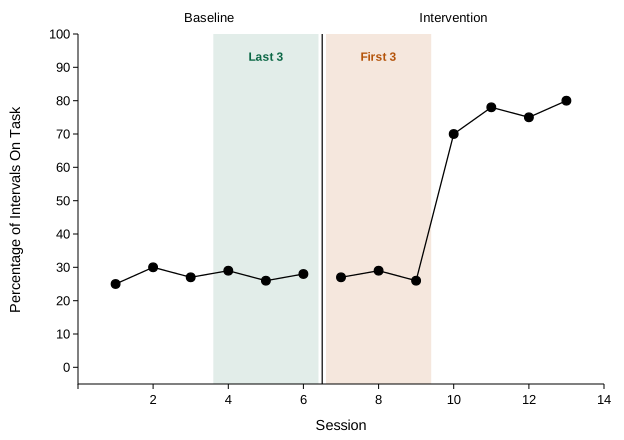
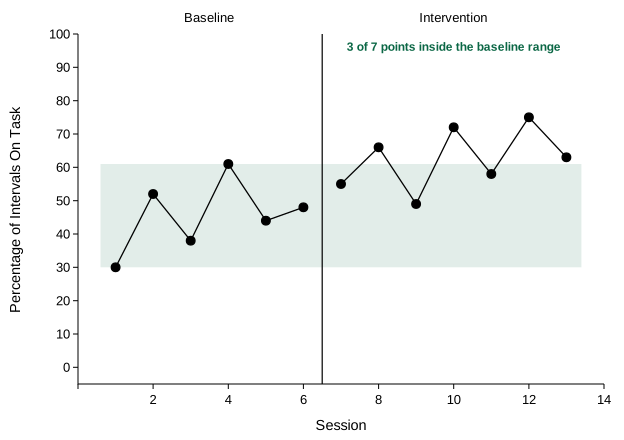
How quickly behavior changes after the phase change. Compare the last three points of one phase with the first three of the next. Immediate changes are more convincing, unless the intervention is expected to work gradually.
5. Overlap
The proportion of data in one phase that falls within the range of the adjacent phase. Less overlap means more separation, but read it together with trend: if baseline was already moving toward the intervention level, intervention data can sit entirely outside the baseline range with no evidence of an effect. In the trend example above, no intervention point falls inside the baseline range, yet the graph gives no evidence that the intervention changed behavior.
6. Consistency across similar phases
Whether phases in the same condition look alike. Compare all the baseline phases, then all the intervention phases. Consistent patterns across repetitions are what make replication convincing.
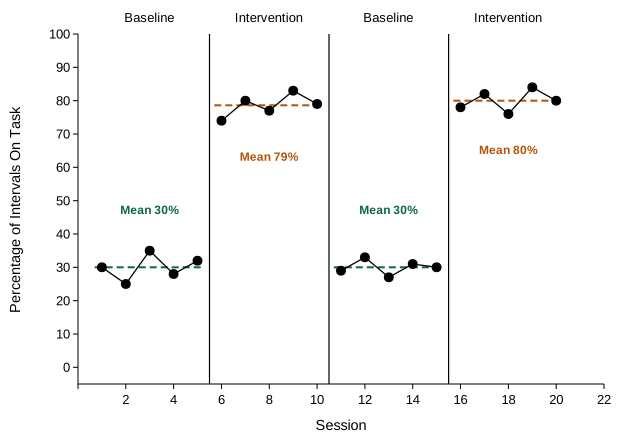
Putting it together. No single feature decides the question. A strong effect usually shows a large change in level, little overlap, an immediate change, stable data within phases, no baseline trend toward the treatment level, and consistent patterns when phases repeat. Ask what the baseline predicted, and whether the next phase broke that prediction. For a full analysis of one graph, from each feature to a conclusion about control, see the worked example in Lesson 2.
Practice
Each graph asks about one feature. The answer is generated from the data, and the explanation shows the numbers.